
Skip to content
The Peekaboot logo

Peekaboot

Peekaboot lets you peek inside your Spring Boot application while it runs.

Peekaboot is beta software and may expose security-relevant settings. Use it at your own risk.

Add the dependency

Requires Java 25, Spring Boot 4.1 and a servlet web application.

Maven

<dependency>
    <groupId>org.peekaboot</groupId>
    <artifactId>peekaboot-spring-boot-starter</artifactId>
    <version>1.0.0</version>
</dependency>

Gradle

implementation("org.peekaboot:peekaboot-spring-boot-starter:1.0.0")

Dev toolbar

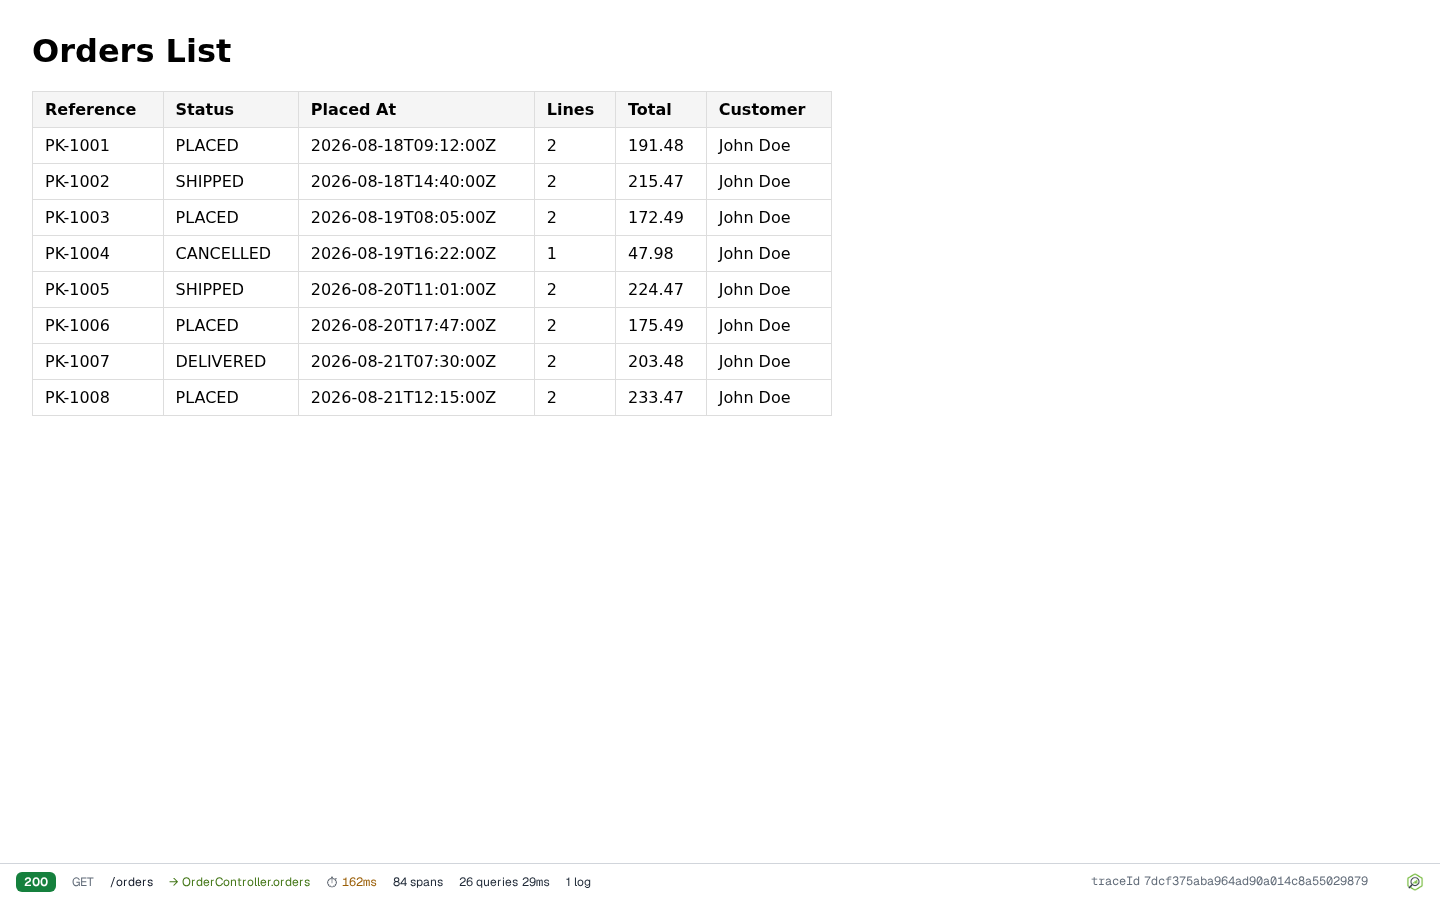
A bar at the bottom of every HTML page your app renders. Click it for request and response detail, the span tree with timings and queries, and the log lines of that request. It also works in Swagger UI. Dev toolbar

The collapsed dev toolbar docked at the bottom of the page, showing a 200 status badge, GET /orders, the controller method, duration, query count and duration, and a copyable trace id

Error page

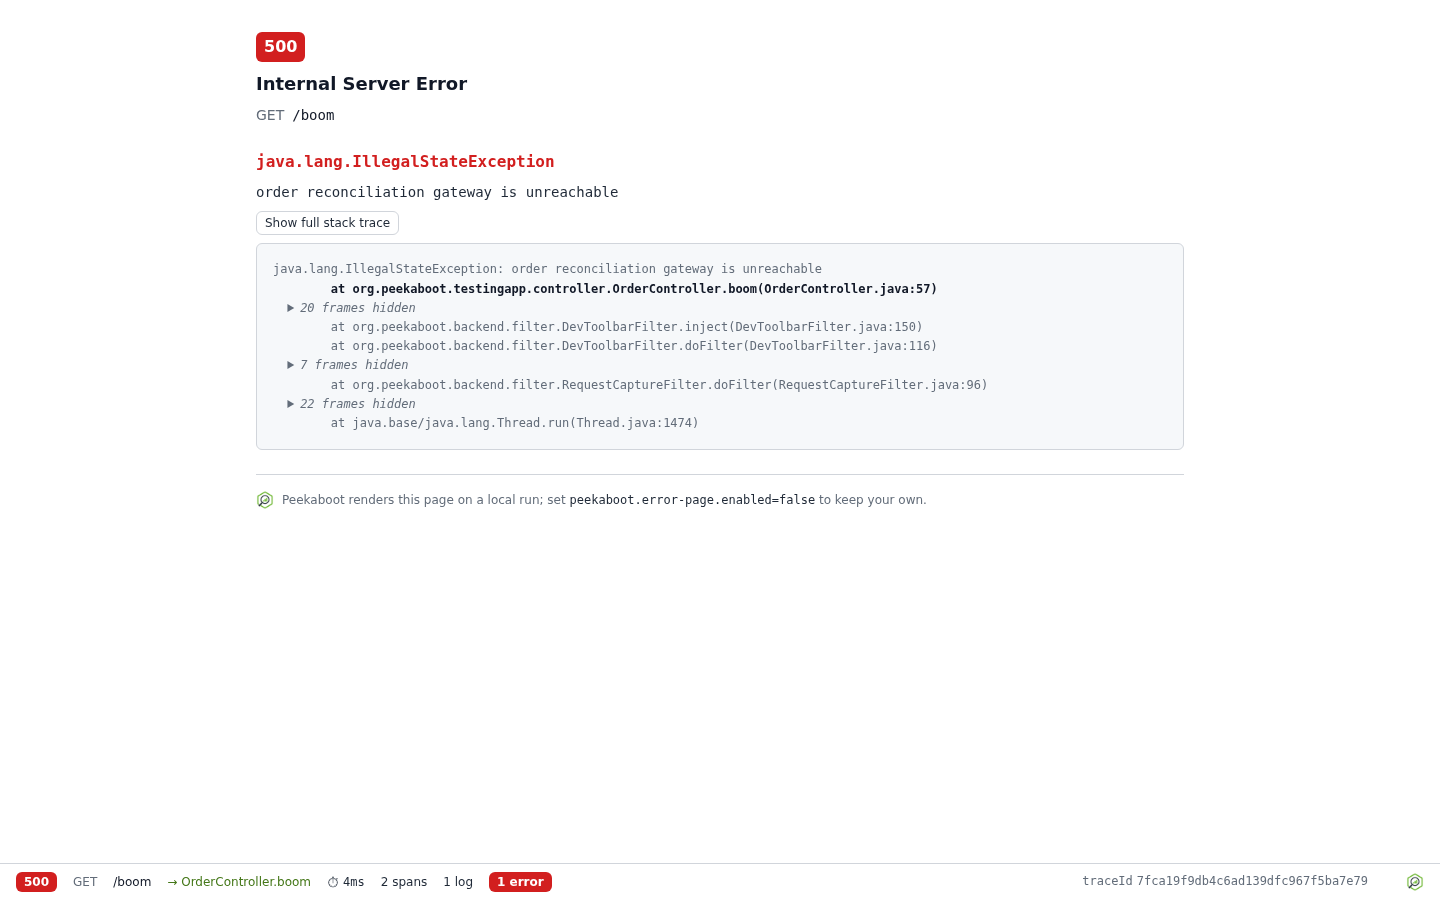
In place of Spring Boot's whitelabel page, errors show the exception, its message and the stack trace with framework frames folded. Error page

Peekaboot's error page for GET /boom: status 500, the IllegalStateException and its message, and the stack trace with the application frame in bold and framework frames folded

Dashboard

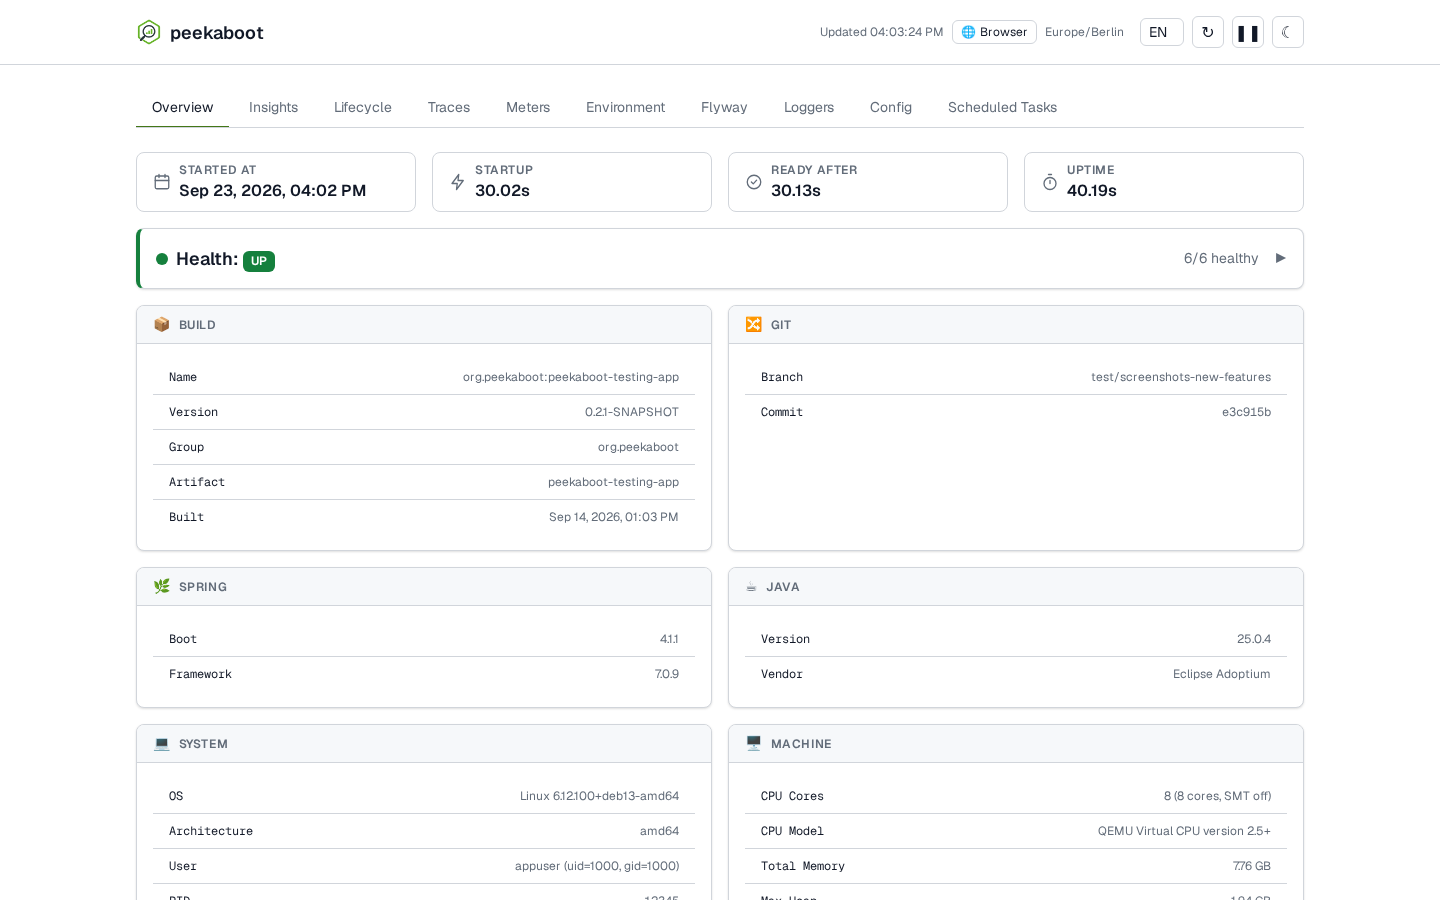
Health, build and Git info, environment, configuration properties, Flyway migrations, logger levels and scheduled tasks, at /peekaboot in your running app. The dashboard

The Peekaboot dashboard's Overview tab, showing Build, Git, Spring, Java, System, JVM Defaults and Datasource cards for a running application

Traces with SQL queries

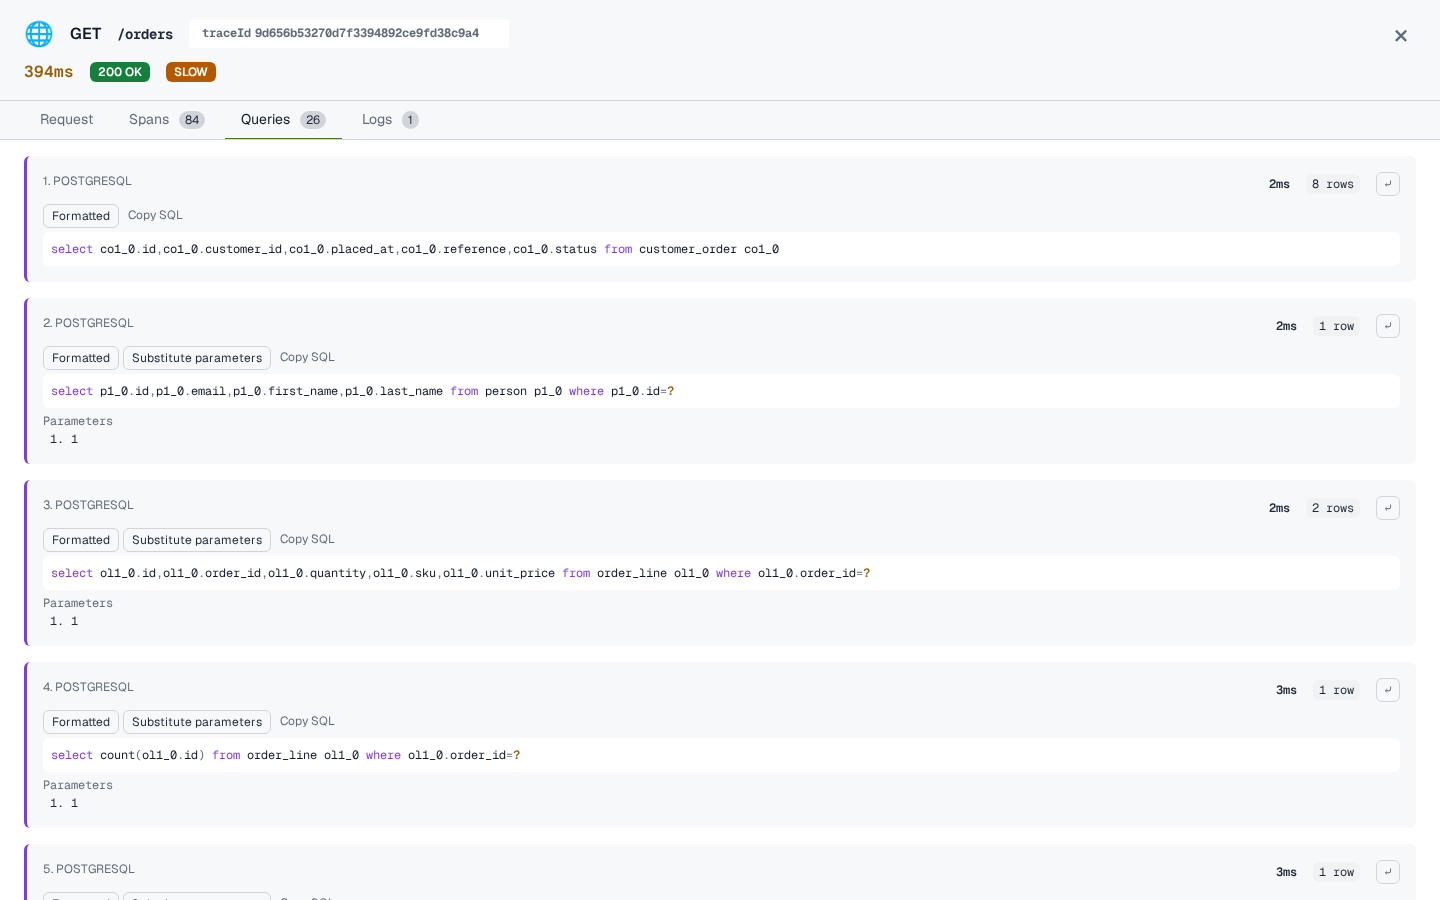
The last 1000 requests your app served, each with its span tree, SQL queries and timings. With context propagation on, work your @Async methods run shows up inside the request that started it. Errors and slow requests are kept in buckets of their own. Traces

The Queries tab for a GET /orders request, listing 26 PostgreSQL statements with their duration and row count, each showing the actual SQL text

Insights

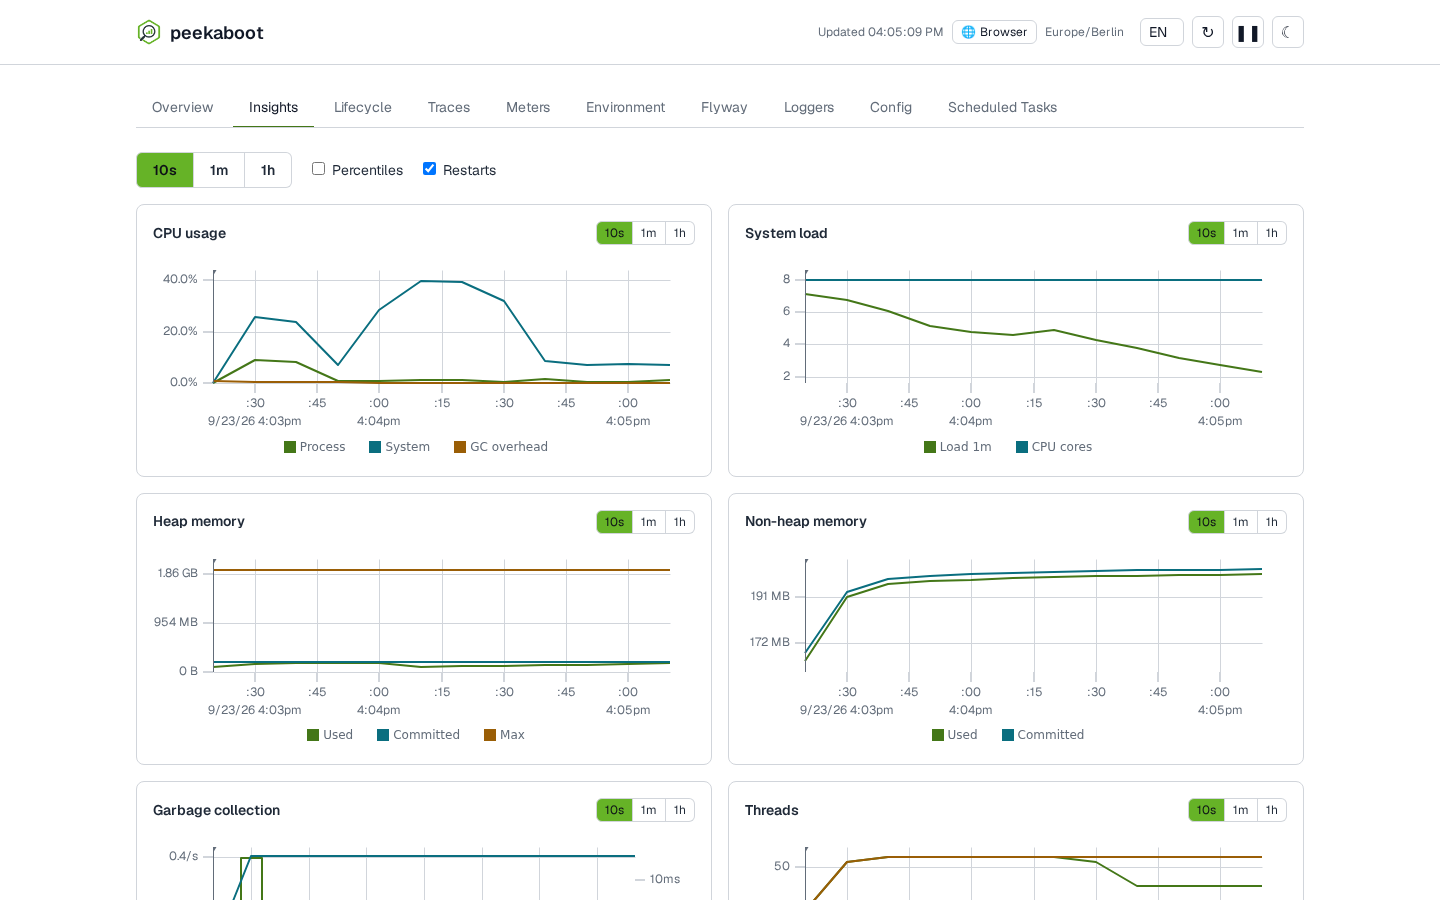
Charts of CPU, memory, HTTP, connection pool and JDBC query metrics over time, from the meters your app already publishes. Insights

The Insights tab, live line charts of CPU usage and system load with an aggregation level switch and toggles for percentiles and restart markers

Off outside a local run

Peekaboot is active when you start your app from the IDE, with spring-boot:run or with bootRun. It stays off for java -jar, wars, native images, containers and tests, unless you turn it on explicitly. Do I want this in production? covers what it costs while it is on and how to keep it out of the artifact.

Why Peekaboot?

Peek, because that's what it does — a look inside a running application. Boot, because that's where it lives. And peek-a-boo, because that's how it behaves: add one dependency and your app's internals are suddenly there; package the jar and they're gone again.

In short: Peekaboot lets you peek inside your Spring Boot application while it runs.

Peekaboot builds on ideas from Symfony's profiler, Spring Boot Admin and others. See the acknowledgements.