Dev toolbar
A bar at the bottom of every HTML page your app renders, with the request, its trace and its logs.
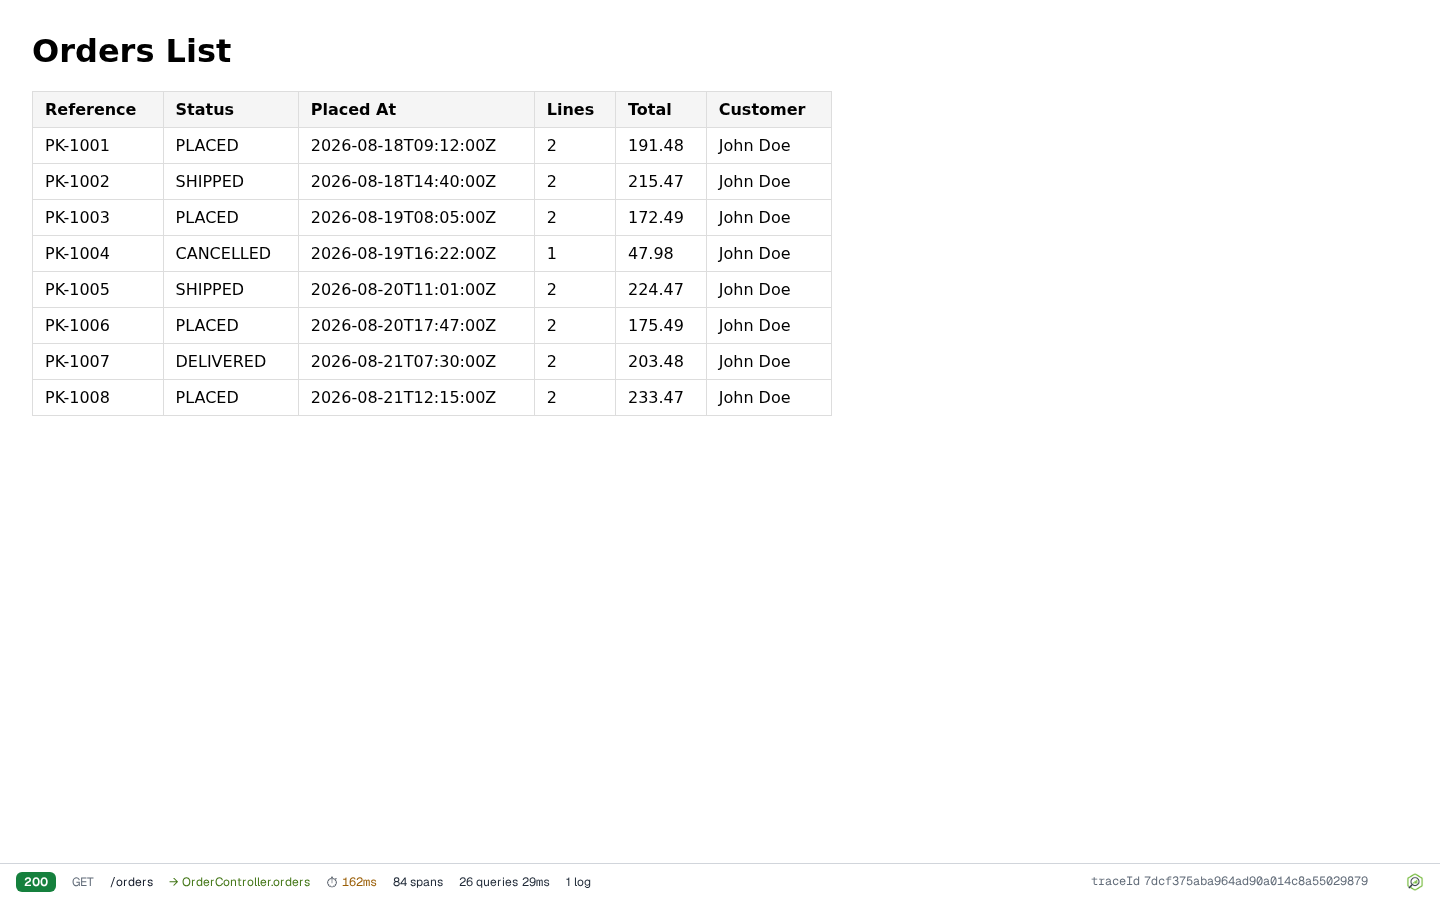
The bar shows the response status, method and path, controller method, duration, span count, query count and total query time, log count, error and warning log counts when there are any, and the trace id, which copies on click. The logo opens the dashboard in a new tab. Click anywhere else on the bar, or press Enter or Space while it has focus, to open the trace view.
The numbers fill in during the first few seconds, so spans that end after the response are counted too. Numbers are formatted in the language chosen on the dashboard.
Turn it on or off
The toolbar needs:
peekaboot.enabled=trueandpeekaboot.dev-toolbar=true. Both default to true only for a local run.- A servlet web application.
- A Micrometer
Tracerbean, which the starter provides. See Quick start for what happens without one.
peekaboot:
  dev-toolbar: false
| Property | Default | Effect |
|---|---|---|
peekaboot.dev-toolbar |
true for a local run, else false |
Injects the bar and captures request detail and logs into traces. |
peekaboot.ui.tracing.slow-query-threshold-ms |
50 |
Queries at or above this are marked SLOW. |
management.opentelemetry.tracing.export.schedule-delay |
200ms while the toolbar is on (Spring Boot: 5s) |
How soon a finished span reaches the bar. Your own value wins. |
See Configuration for everything Peekaboot changes in your application.
Pages that get the bar
A response gets the bar when its content type is text/html and it contains </body>. It
does not get the bar when:
- The path starts with
/peekaboot/,/static/,/webjars/,/error/or the management base path (/actuator/by default, followingmanagement.endpoints.web.base-path). - The path ends in
.css,.js,.ico,.png,.jpg,.jpeg,.gif,.svg,.woff,.woff2,.ttfor.eot. - The request sends
X-Requested-With: XMLHttpRequest. A plainfetch()does not send it, so HTML fetched that way gets the bar. - The handler responds asynchronously.
- The HTML body is larger than 2 MiB. It is served unchanged.
To inject the bar, Peekaboot holds each HTML response in memory, up to 2 MiB. If generating the bar fails, the page is served unchanged. Your page’s CSS does not affect the bar.
Request and response detail
The Request tab of the trace view shows the method, path, query string, status, duration, controller method, query and form parameters, and the request and response headers.
Headers and parameters are masked on the server, by key name and by value patterns. There is no reveal control, so a masked value stays masked. See Security for the rules and what they miss. Request bodies and uploaded file names are not captured.
The trace view
Clicking the bar opens the same trace view the dashboard’s Traces tab uses, on top of your page. Traces describes its Spans, Queries, Logs and Request tabs.
Logs for the request
The Logs tab lists every log line your app wrote while handling the request, with timestamp, level, message and the active span.
Log lines are not masked. A log statement that includes a secret or personal data is stored and shown exactly as written. See Security for what is exposed while the toolbar is on.
Swagger UI
On the Swagger UI page the bar starts idle with “Waiting for request…”. Run an operation with “Try it out” and the bar shows that call’s status, duration and query count. Click it for the trace view.
This works for any traced call, JSON APIs included. Calls to /v3/api-docs, /swagger-ui/,
/peekaboot/, /webjars/ and the actuator are not shown. With
management.endpoints.web.base-path=/, actuator calls are traced and do show up.
A custom springdoc.swagger-ui.path is honoured.
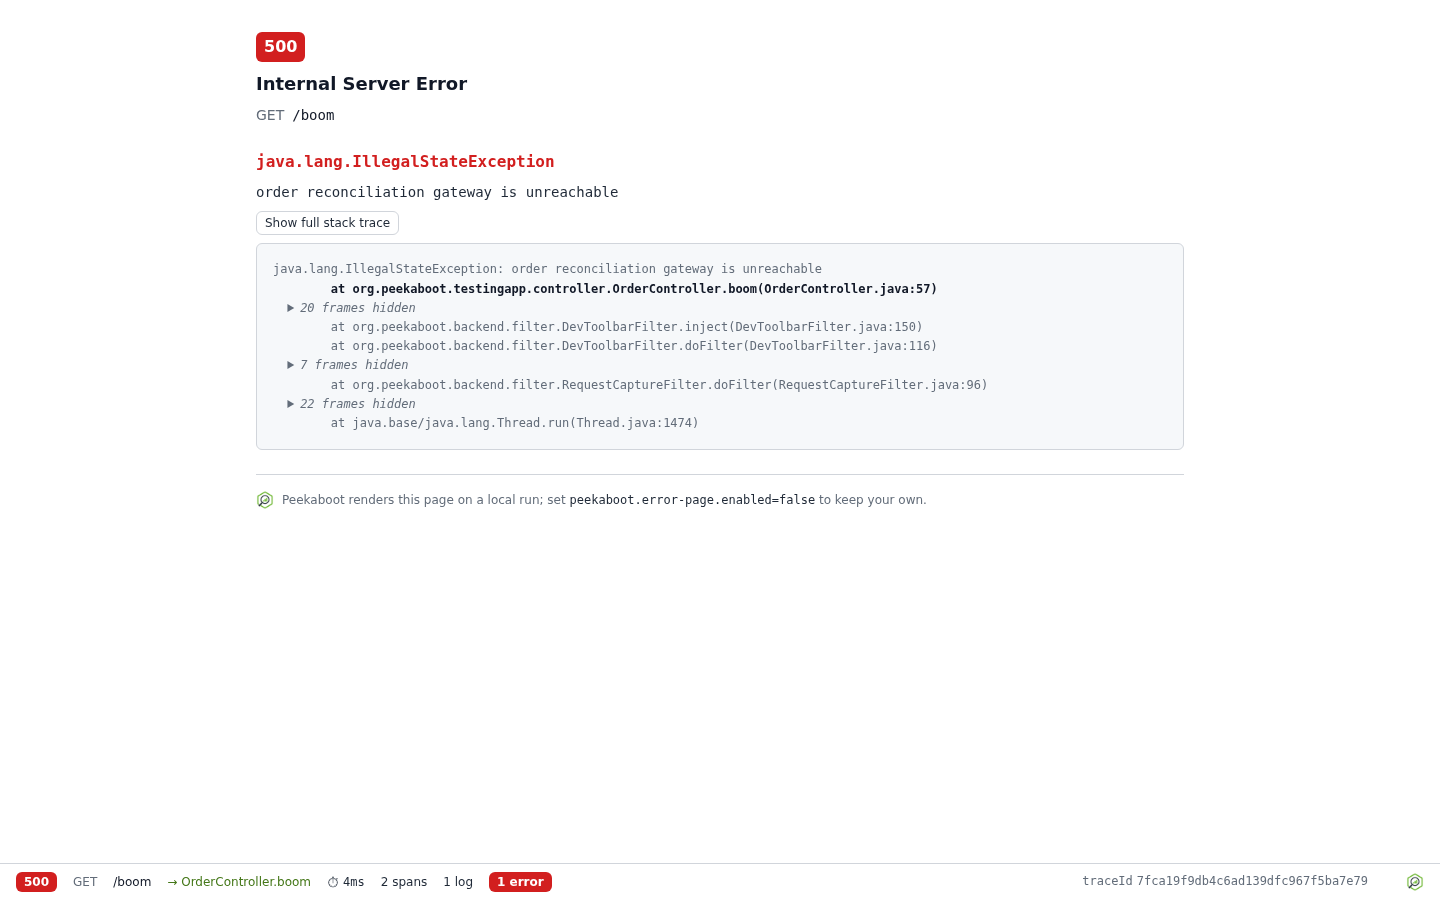
The bar on the error page
HTML error pages get the bar, including Peekaboot’s error
page. It reports the request
that failed, not the /error dispatch that rendered the page. A request that Spring Security
rejects before it reaches your application, such as a 401 or 403, gets no bar on its error
page.
With Spring Security
The bar loads its data from /peekaboot/**. A reader who is not allowed there sees the bar
with this notice instead of the numbers:
Peekaboot toolbar could not start — sign in, or check that its script is allowed to load
The same notice appears when a Content-Security-Policy blocks the bar’s script. See Security, the dev toolbar asks the reader to sign in.