Quick start
Add the starter, run your app, open the toolbar and the dashboard.
Add the dependency
Maven
<dependency>
    <groupId>org.peekaboot</groupId>
    <artifactId>peekaboot-spring-boot-starter</artifactId>
    <version>1.0.0</version>
</dependency>
Gradle
implementation("org.peekaboot:peekaboot-spring-boot-starter:1.0.0")
To keep Peekaboot out of the executable jar in Gradle, declare it developmentOnly instead.
Spring Boot’s Gradle plugin still puts it on the bootRun class path:
developmentOnly("org.peekaboot:peekaboot-spring-boot-starter:1.0.0")
For Maven, see Keeping it out of the artifact.
What your application needs
- Java 25 or newer.
- Spring Boot 4.1. Earlier 4.x releases are untested.
- A servlet web application.
Peekaboot serves the dashboard and the toolbar on servlet (Spring MVC) applications only. On WebFlux or a non-web application they are absent, and startup is unaffected.
Run your app
Start it from your IDE, with mvn spring-boot:run or with gradle bootRun. Peekaboot turns
itself and the dev toolbar on for these launches.
The toolbar docks to the bottom of every HTML page your app renders.
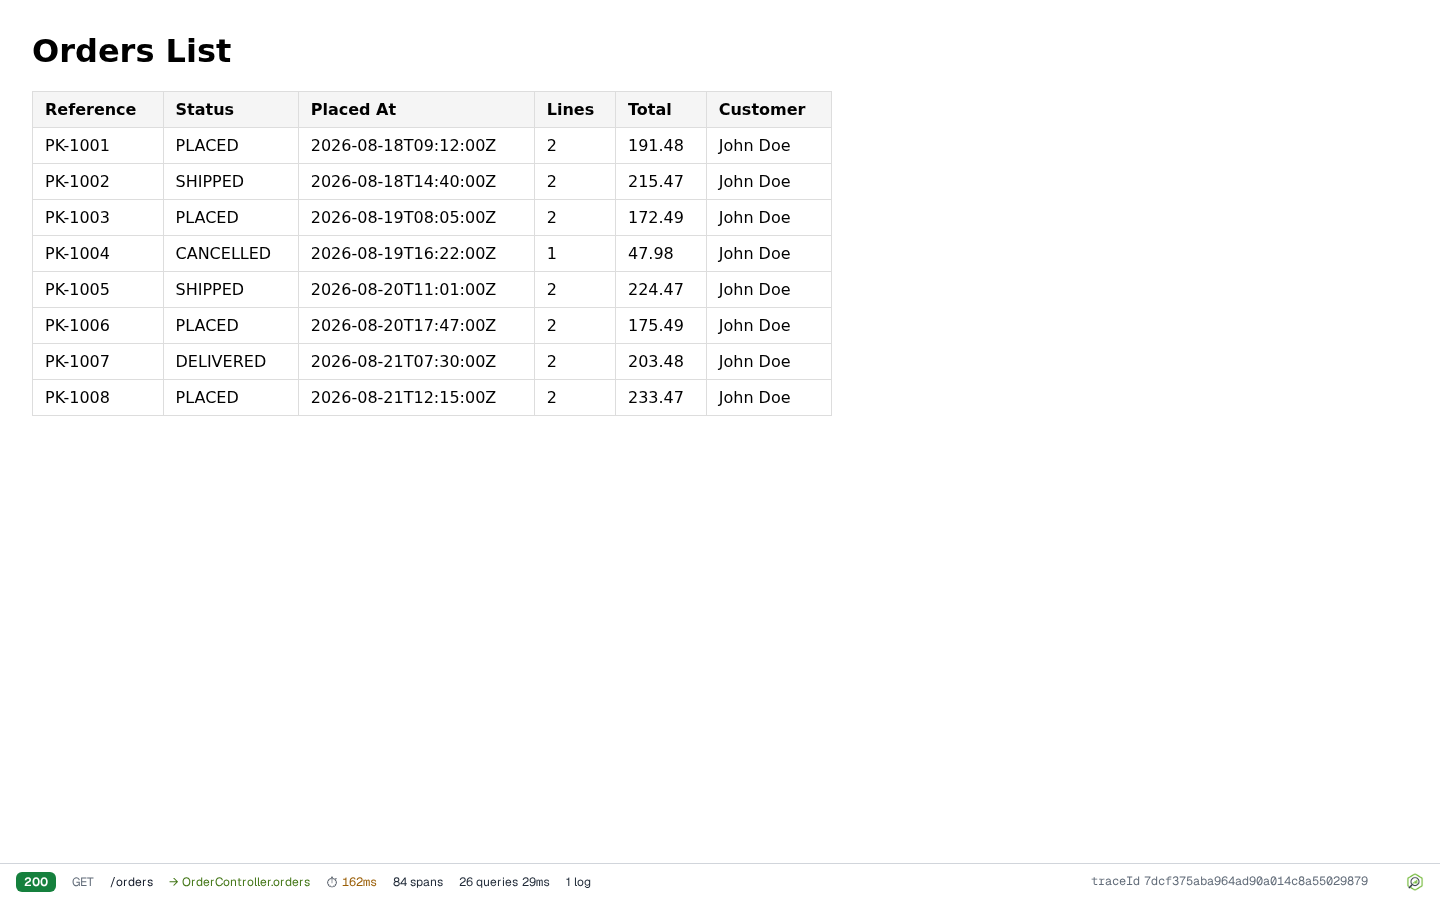
Click the bar for request and response detail, the trace view and the request’s logs. See Dev toolbar.
Set peekaboot.dev-toolbar: false to turn the toolbar off and keep the dashboard.
Peekaboot is off in a devcontainer. A container never counts as a local run. Turn it on with the properties below; see Configuration, containers.
Turn it on outside a local run
These properties default to true for a local run and to false for java -jar, wars,
native images, containers and tests. Any value you set wins.
| Property | Default | Effect |
|---|---|---|
peekaboot.enabled |
local run only | The dashboard, its API and Peekaboot’s Spring Boot defaults. Every other switch also needs it. |
peekaboot.dev-toolbar |
local run only | The toolbar, log capture and request-detail capture. |
peekaboot.storage.enabled |
local run only | Keeps the charts and the run history in ~/.peekaboot across restarts. |
peekaboot.error-page.enabled |
local run only | Peekaboot’s error page in place of Spring Boot’s whitelabel page. |
peekaboot.stack-trace.fold |
local run only | Folds framework frames on the error page and in the Logs tab. |
Outside a local run, Peekaboot also protects /peekaboot/** with HTTP Basic
(peekaboot.security.enabled). Read Do I want this in
production? before you turn it on anywhere shared.
All other properties are in Configuration.
Open the dashboard
The dashboard is at http://localhost:8080/peekaboot/,
its API under http://localhost:8080/peekaboot/api/.
On another port or context path, use the URL on the Peekaboot Dashboard: line Peekaboot
logs once the application is ready. See
Configuration.
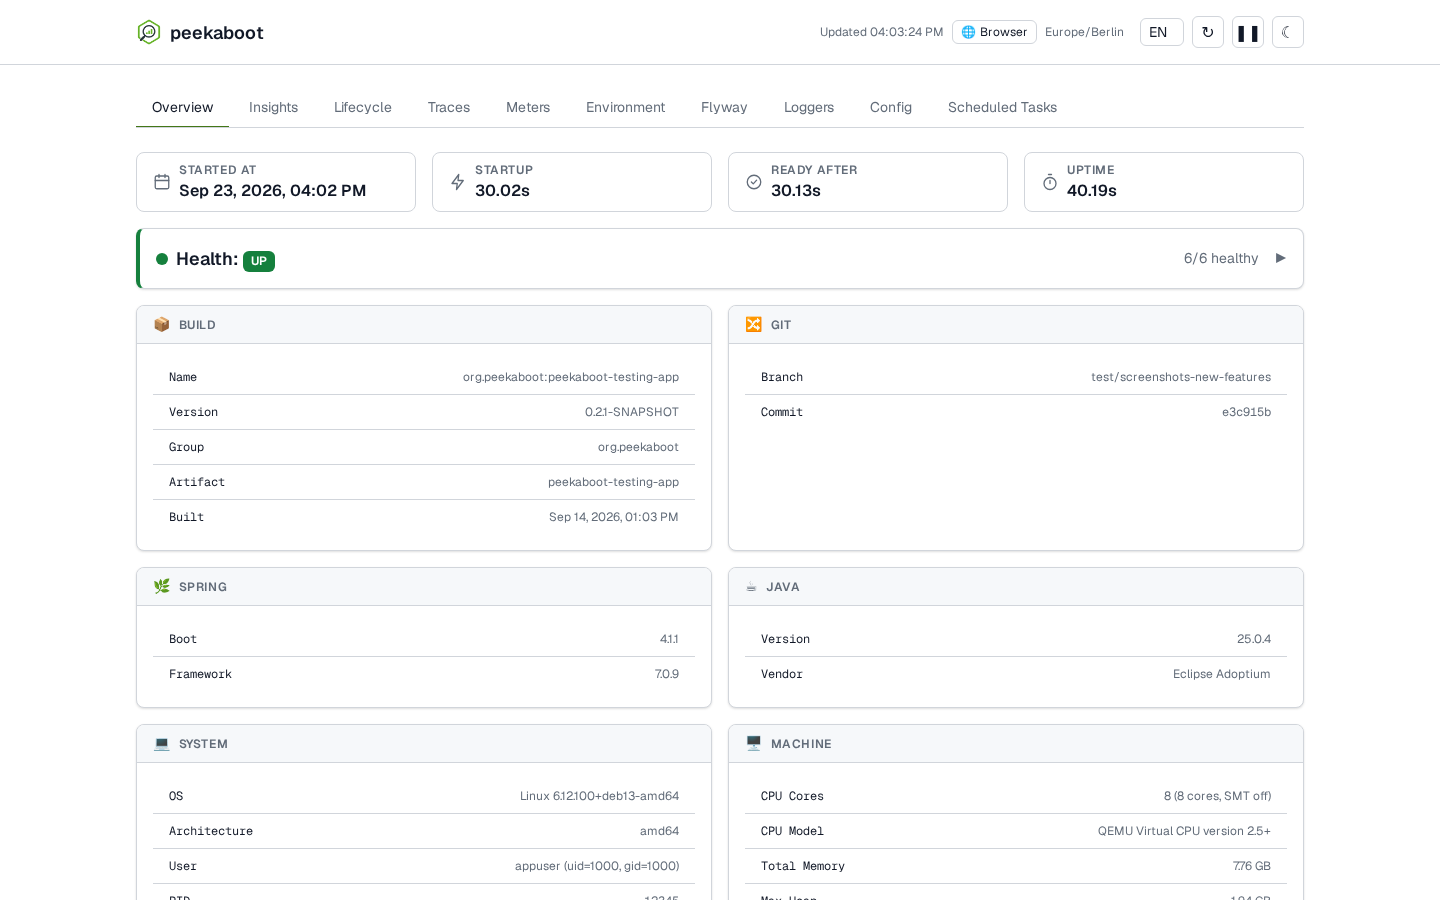
What you get immediately
- The dev toolbar on every page: request and response detail, the trace view, and the request’s logs
- Overview: build and Git info, Spring Boot and Java versions, system and JVM details, and datasource status
- Environment and Config: every property source Spring resolved, and every
@ConfigurationPropertiesbean’s effective values - Flyway migration history, runtime logger levels, and scheduled tasks
- Every meter in Micrometer’s registry on Meters, and the key ones charted over time on Insights
- Traces with spans and SQL queries for the last 1000 requests, oldest evicted first
(
peekaboot.tracing.max-traces; see Traces)
What the starter brings
Adding peekaboot-spring-boot-starter pulls in:
org.peekaboot:peekaboot-spring-boot-autoconfigurespring-boot-starterspring-boot-starter-actuatorspring-boot-starter-opentelemetrydatasource-micrometer-spring-bootanddatasource-micrometer-opentelemetry, which capture your JDBC queries
Peekaboot requires the OpenTelemetry bridge the starter brings. Brave is not supported: with the Brave bridge the Traces tab stays empty and the toolbar never shows a trace.
If you exclude one of them
Startup never fails because of a missing piece.
| Missing | What happens |
|---|---|
A Micrometer Tracer bean |
The dev toolbar is absent. The rest of the dashboard works. |
| The OpenTelemetry SDK | The Traces tab stays empty. |
A Micrometer MeterRegistry bean |
The Meters and Insights tabs, the insights API and the Overview stat tiles are absent. See Insights. |