Traces
The last thousand requests, jobs and messages your application handled, with their spans, SQL and logs, held in memory.
Peekaboot keeps a copy of every span your application exports in an in-memory store. The dashboard’s Traces tab lists them, and the dev toolbar shows the trace of the page you are looking at.
The store is one more span exporter next to the ones you configured. An existing OTLP, Zipkin or Jaeger pipeline keeps working unchanged. Peekaboot adds no exporter that sends data out of the process, and it turns Micrometer’s OTLP metrics export off.
Requirements
peekaboot.enabled=true. It defaults to true only for a local run.peekaboot.tracing.enabled, which defaults totrue.- A servlet web application. A WebFlux application records no traces.
- The OpenTelemetry SDK, which the starter brings. An application that uses the Brave bridge instead gets an empty Traces tab.
Queries appear for JDBC only. The starter adds datasource-micrometer, which instruments your
DataSource beans. If you instrument your DataSource yourself, exclude the starter’s copy or
set jdbc.datasource-proxy.enabled=false. R2DBC is not instrumented.
What gets recorded
Every span your application exports: HTTP requests, scheduled jobs, message consumers, and the database queries and outbound calls they make.
Peekaboot sets management.tracing.sampling.probability to 1.0 (Spring Boot’s default is
0.1). Your own setting wins, and Peekaboot sees only sampled spans. Sample at 10% and it
records 10%.
Requests under these path prefixes are never recorded: /static/, /webjars/,
/peekaboot/, /error/, and the management base path (/actuator/ by default, following
management.endpoints.web.base-path). With the base path set to / there is no prefix to
exclude, and actuator requests are recorded like any other.
With the dev toolbar on, each trace also holds the request and response headers and parameters and the log lines written while handling it. Without the toolbar, traces hold spans only.
Spans Peekaboot adds
Peekaboot raises three observations of its own. They are ordinary Micrometer observations, so every exporter you configured receives them too.
| Span | Around | Tags |
|---|---|---|
spring.handler |
The controller method | handler.type, handler.name |
spring.view.render |
View rendering, only when the handler resolved a view | view.type, view.name |
async task (observation peekaboot.async.task) |
A task run on one of Spring’s task executors, see background work | peekaboot.async, peekaboot.async.thread |
Spans opened inside the controller method, such as JDBC and HTTP client calls, nest under
spring.handler. peekaboot.tracing.async=false turns off the async span alone.
peekaboot.tracing.enabled=false removes all three.
Background work
Work handed to a Spring task executor, for example an @Async method, runs on another thread.
To see it inside the trace that started it, set:
spring:
  task:
    execution:
      propagate-context: true
Peekaboot does not set spring.task.execution.propagate-context. Spring Boot leaves it
off. Without it, background work shows as separate traces with nothing linking them to the
request that started them.
Peekaboot wraps tasks on executors that Spring Boot builds: the auto-configured
applicationTaskExecutor, and any executor you create from Boot’s
ThreadPoolTaskExecutorBuilder or SimpleAsyncTaskExecutorBuilder. Declaring an Executor
bean of your own makes Boot skip applicationTaskExecutor. Set
spring.task.execution.mode=force to keep it. See
peekaboot.tracing.
With context propagation on:
- Each task gets an
async taskspan inside the trace that submitted it. A task submitted with no trace in scope gets none. - The request’s duration and the Slow bucket check leave the background work out. A request that returns in 50ms reports 50ms, however long its task runs.
- Errors and queries in background work still count. A failing task puts its trace in Errors.
- In the trace’s Spans tab, the task starts collapsed and carries a background chip.
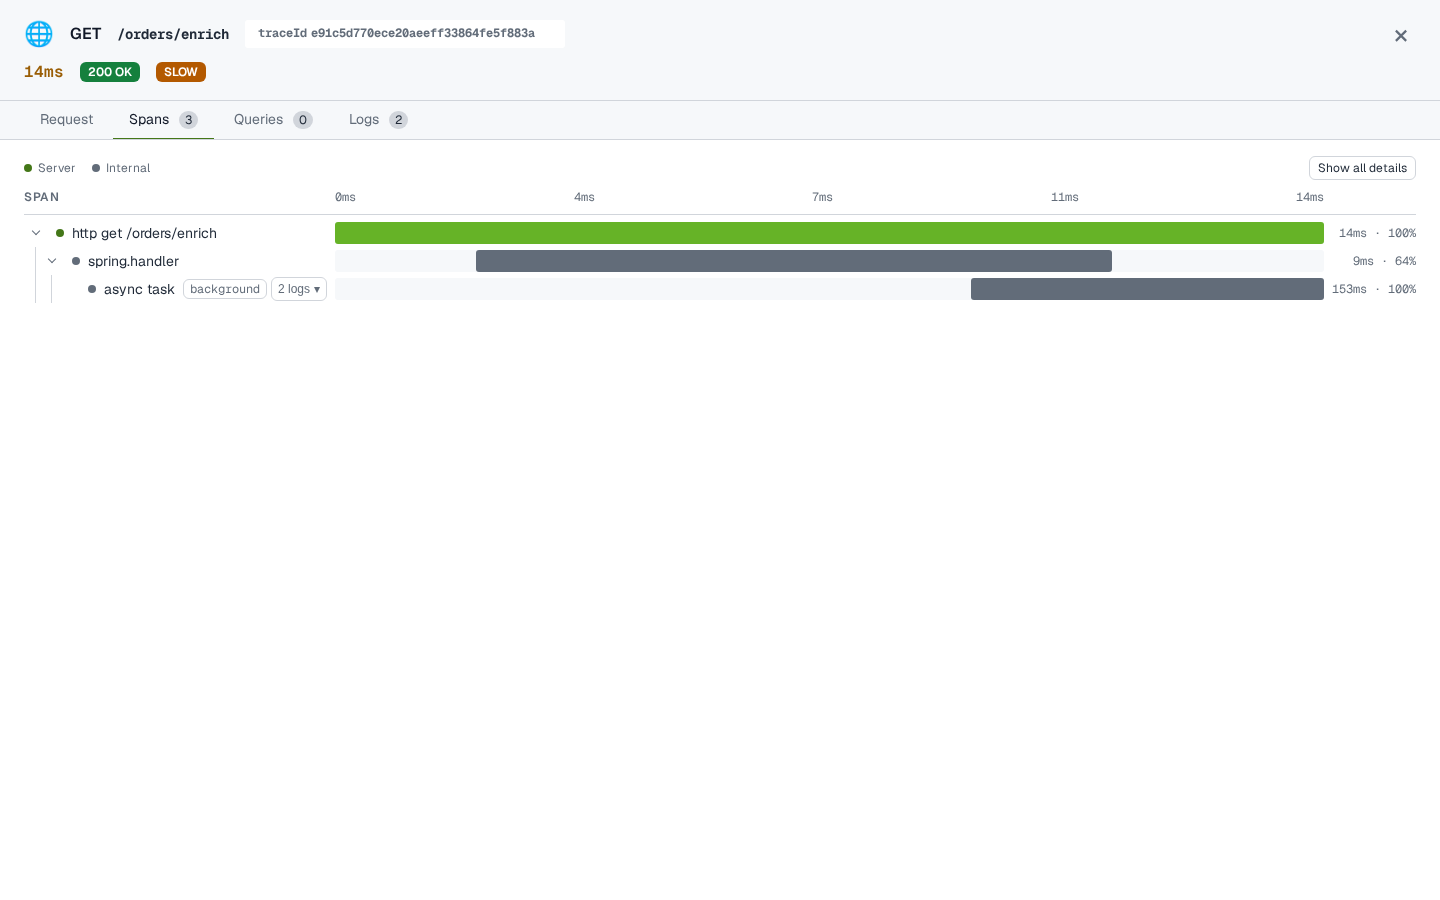
Each task is also listed as its own row of type Async Task, timed on its own. The row links to the trace that started it while that trace is still in the store. One trace can therefore produce several rows.
Every async span is named async task. To see which method ran, put
@Observed(contextualName = "...") on it. Its span then appears under async task.
@Scheduled runs get no async span and keep the Scheduled type.
Trace types
Each row in the trace list shows what started the trace. The Traces tab filters by it.
| Value | Icon | Means |
|---|---|---|
| HTTP | 🌐 | An inbound web request |
| Messaging | 📩 | A message picked off a queue or topic |
| RPC Call | 🔗 | An inbound remote-procedure call, gRPC for example |
| Scheduled | 🕑 | A @Scheduled method fired by Spring’s scheduler |
| Async Task | ⚡ | Background work on a Spring task executor |
| Database | 🗂 | A database call with no request, job or message around it |
| Connection Pool | 🔌 | The pool acquiring or validating a connection outside any traced work |
| Unknown | ❓ | Anything else, such as in-process work, a message being sent or an outbound call whose caller was not traced |
Only @Scheduled methods fired by Spring’s scheduler show as Scheduled. Quartz, a plain
ScheduledExecutorService or another timer shows as Unknown or by whatever else its tags
match.
The trace view
Click a row on the Traces tab, or click the dev toolbar, to open a trace. The view has four tabs and opens on Spans.
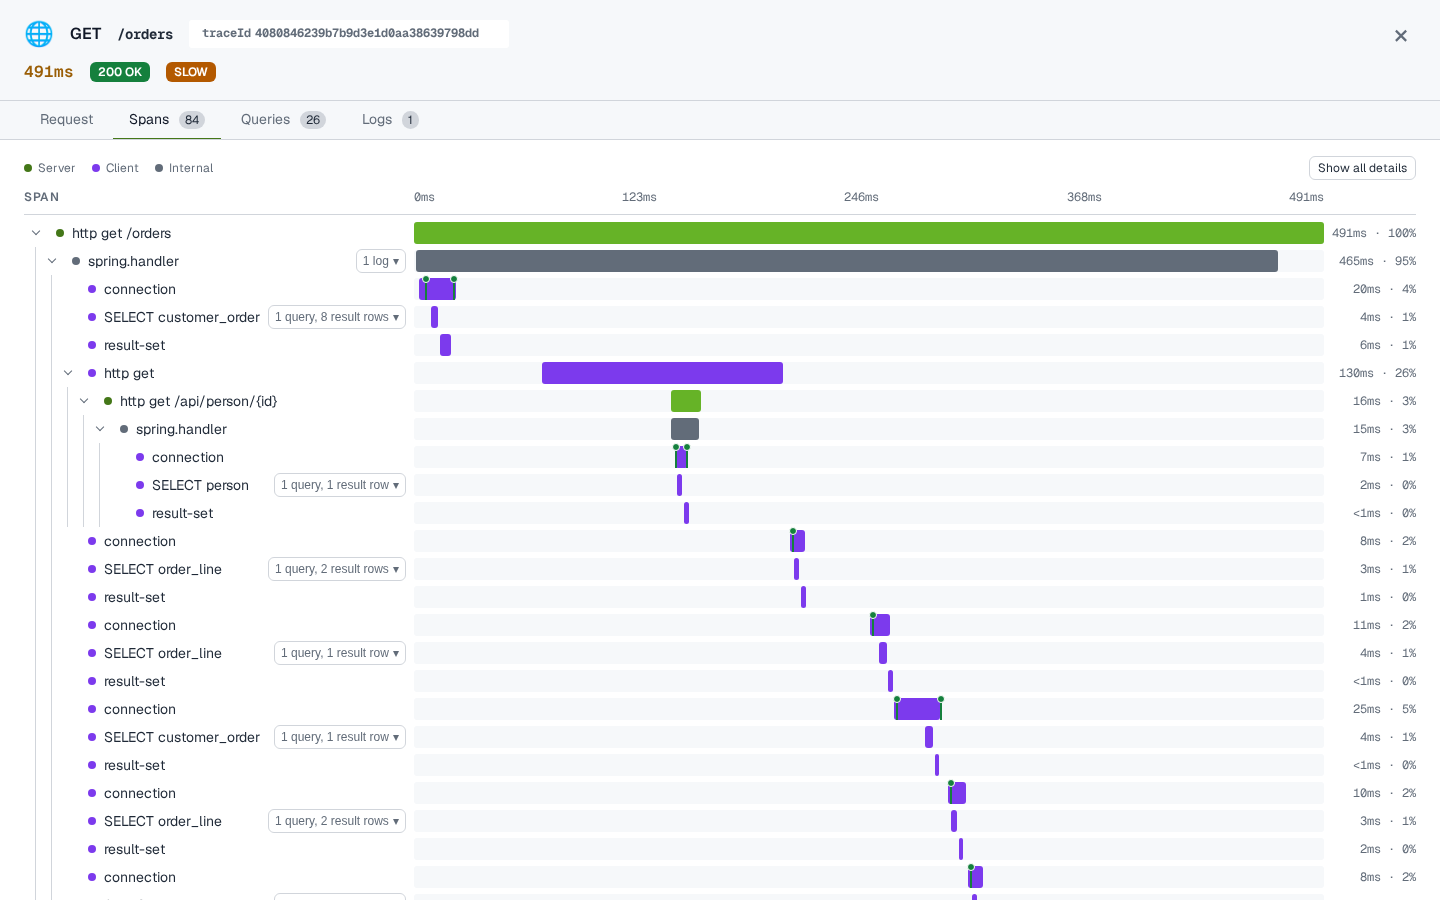
Spans shows the span tree with each span’s kind, tags and duration, nested as they ran. Click a span’s name for its details: kind, a copyable span id, and where they apply the error class and message, and the full tags. A query span also carries a “1 query” button, and a span that logged an “N logs” button; each opens its own panel in place - the statement with its row count, or that span’s own logs, stack traces folded as on the Logs tab.
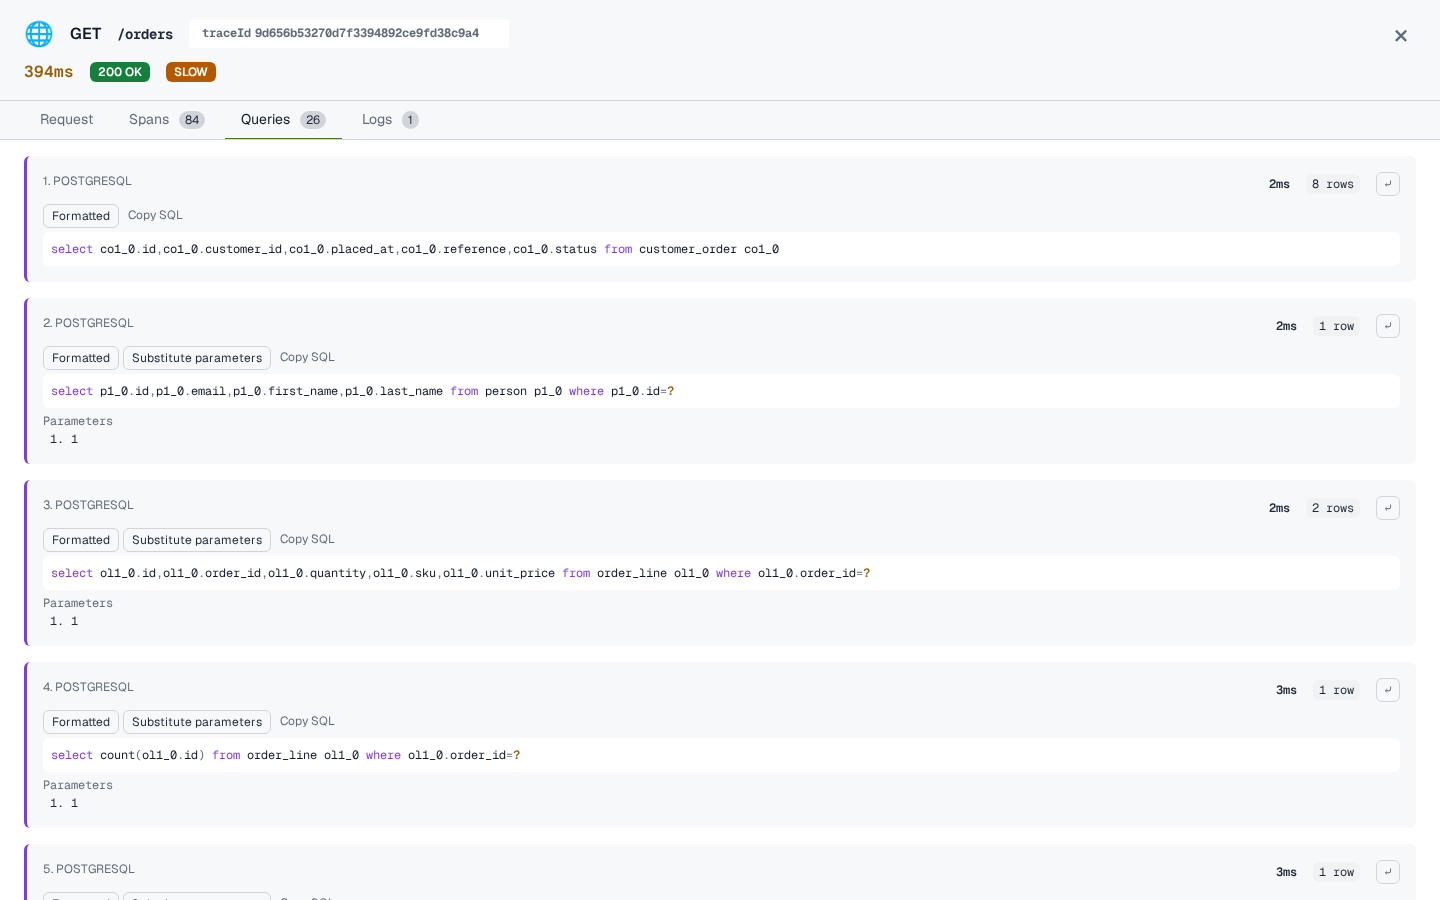
Queries lists the SQL the trace ran, one row per statement, with duration and row count where
the instrumentation records it. A query at or above
peekaboot.ui.tracing.slow-query-threshold-ms (default 50ms) is marked SLOW. A JDBC batch is
one row with its statements joined. A query recorded without statement text is listed without
SQL.
A statement shows as captured, highlighted. With Hibernate on the classpath, Formatted lays it
out the way Hibernate’s format_sql log does. Its bind parameters are listed under it, one list
per batch entry, masked like the SQL. Substitute parameters puts them in place of the ?
placeholders when there is one set and it fits. The copy button copies the SQL as shown. A bind
value over 1000 characters is cut with a comment like /* 7 characters omitted */; a batch
records at most 100 parameter sets.
Logs lists the log lines written while handling the request, filterable by text, level and span. Request shows the method, path, query string, status, duration, controller method, parameters, and request and response headers. Logs and Request are filled only while the dev toolbar is on. See Dev toolbar for what is masked and what is not.
A query or a log line jumps back to its span in the tree; a span’s own query and logs sit beside its attributes instead of linking out to the other tabs.
Status and issues
A trace is OK, or HAS_ERRORS when any span ended with an error. Slowness is not a status. It shows as span issues and the Slow bucket.
Issues
An issue marks one span in the tree. The thresholds live under peekaboot.ui.tracing, see
Configuration.
| Issue | Raised when | Property (default) | Severity |
|---|---|---|---|
| VERY_SLOW | The span’s own duration reaches the threshold | very-slow-span-threshold-ms (500) |
Error |
| SLOW | The span’s own duration reaches the threshold, and it is not VERY_SLOW | slow-span-threshold-ms (100) |
Warning |
| ERROR | The span ended with an error | none | Error |
| SLOW_QUERY | A query’s duration reaches the threshold | slow-query-threshold-ms (50) |
Warning |
“Reaches” means at or above the threshold.
Buckets, limits and memory
Every trace is in All. A trace that qualifies is also in Errors, Slow, or both.
| Bucket | Holds | Size property (default) |
|---|---|---|
| All | Every trace | peekaboot.tracing.max-traces (1000) |
| Errors | Traces with an errored span or an ERROR log line |
peekaboot.tracing.max-error-traces (100) |
| Slow | Traces whose duration, background work excluded, reaches peekaboot.tracing.slow-trace-threshold-ms (1000) |
peekaboot.tracing.max-slow-traces (100) |
Error log lines are captured only while the dev toolbar is on. Without it, Errors admits on errored spans alone.
When a bucket is full, it drops the trace it admitted first. The buckets evict independently, so a trace can stay under Errors or Slow after it has left All. Nothing expires on a timer, and everything is gone at restart.
A span that arrives after All dropped its trace brings the trace back to the top of All if Errors or Slow still holds it. Otherwise it appears as a new trace holding only the late spans.
A trace can leave Slow before it is evicted. While a background task is still running, its
spans can count toward the duration for a moment. Once the task’s async task span arrives,
the duration drops back to the request’s own time, and the trace leaves Slow if that is under
the threshold.
One trace keeps at most peekaboot.tracing.max-spans-per-trace spans (500) and
peekaboot.tracing.max-logs-per-trace log lines (500). Past either limit the oldest are
dropped. A trace that lost spans carries a TRUNCATED badge. In the worst case the store holds 1000 traces in All
plus up to 200 that only Errors or Slow still keep, each with 500 spans and 500 log lines.
Lower the limits on a memory-constrained application, see
Configuration.
The SLOW badge and the Slow bucket
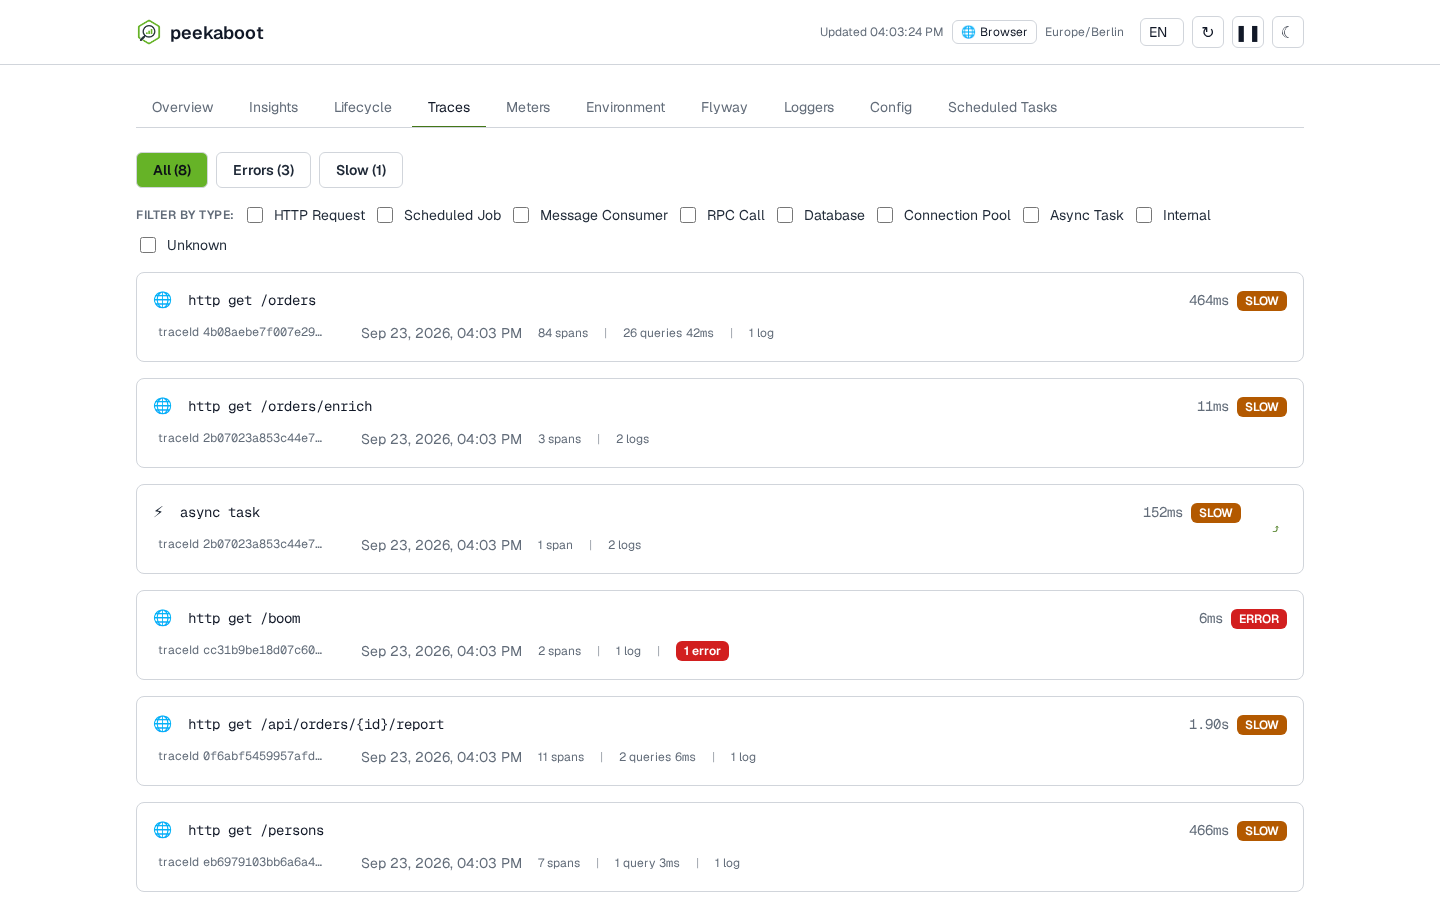
The SLOW badge on a row means one span in the trace reached slow-span-threshold-ms (100ms).
The Slow bucket counts traces whose whole duration reached slow-trace-threshold-ms (1000ms),
so many more rows carry the badge than the bucket holds. A trace with an error shows the ERROR
badge instead of SLOW, so counting SLOW badges misses slow traces that also failed.
Limitations
Peekaboot sees only the spans of the process it runs in. Two services that call each other
show two partial traces under the same trace id, on two dashboards. It reads the W3C
traceparent header and never changes it, so propagation works as Spring Boot’s tracing
support configures it.
It keeps no history past the limits above or past a restart, does not aggregate across instances, and does not alert. The percentiles on Insights are percentiles of aggregates.
For tracing across services, retention or alerting, export to an OTLP backend such as Grafana Tempo or Jaeger next to Peekaboot.