Insights
Live charts over the Micrometer meters your application already publishes, kept in memory inside your process.
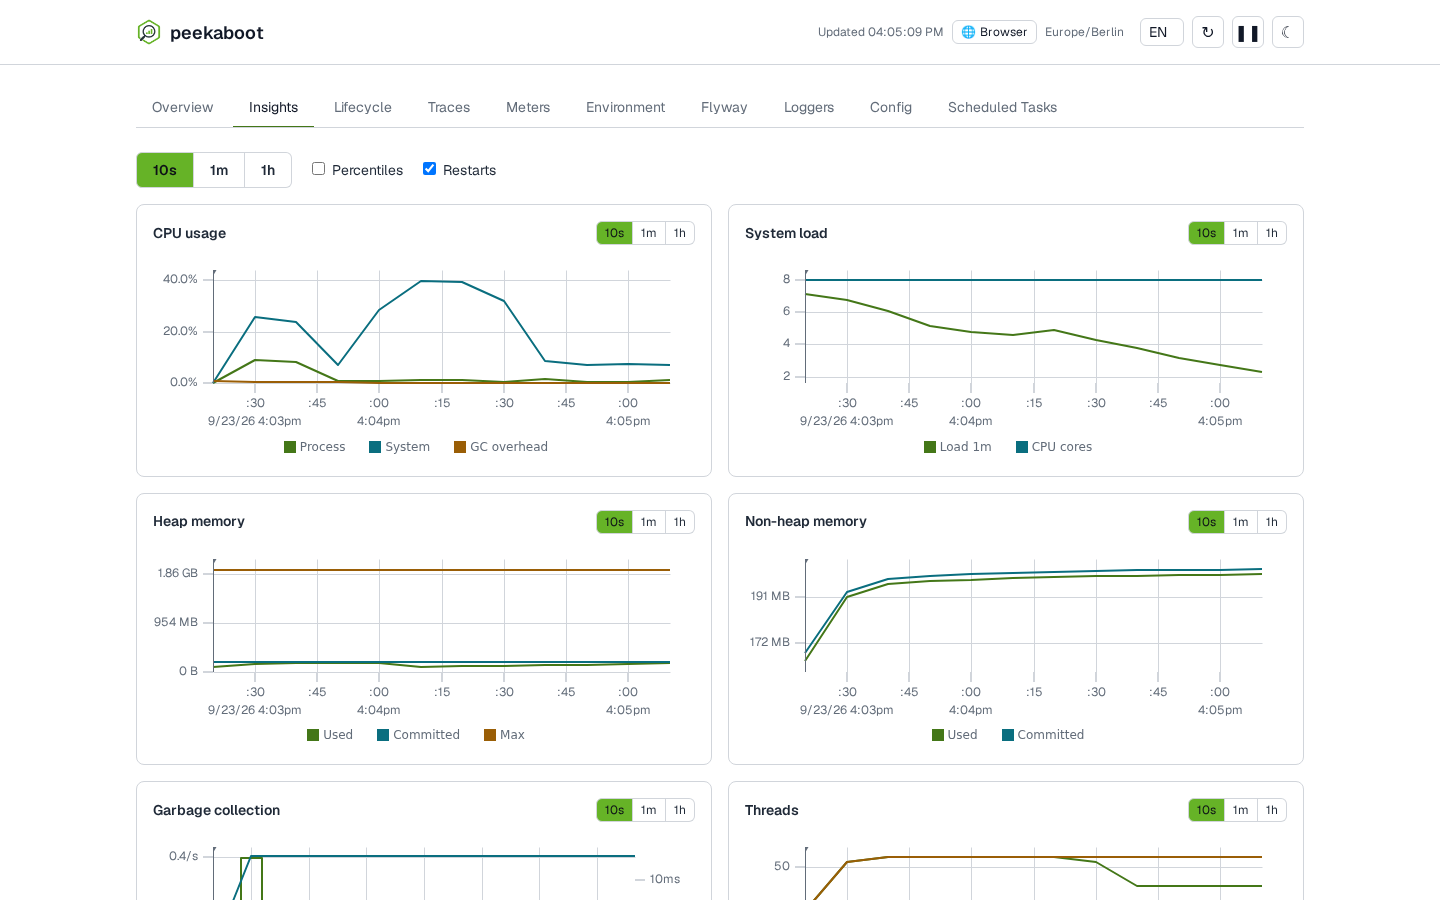
The Insights tab charts CPU, memory, garbage collection, threads, HTTP, the connection pool, JDBC, repositories, transactions, disk space and log events. It keeps up to 30 days of history at three resolutions, in memory, inside your application. You can switch on more panels or add your own.
When the tab appears
The Insights tab needs all of:
- a servlet web application,
peekaboot.enabled, on by default for a local run only. See Configuration,peekaboot.insights.enabled,trueby default,- a Micrometer
MeterRegistrybean. Spring Boot Actuator provides it, and the starter brings Actuator.
If one is missing, the tab is absent. See The dashboard for the other tabs.
The default panels
These panels are on by default, in display order. A panel whose meters do not exist (no Hikari
pool, no Hibernate, no datasource-micrometer) shows “No data”.
| Panel | id | Series | Meters |
|---|---|---|---|
| CPU usage | cpu |
Process, System, GC overhead | process.cpu.usage, system.cpu.usage, jvm.gc.overhead |
| System load | load |
Load 1m, CPU cores | system.load.average.1m, system.cpu.count |
| Heap memory | heap |
Used, Committed, Max | jvm.memory.*{area=heap} |
| Non-heap memory | nonheap |
Used, Committed | jvm.memory.*{area=nonheap} |
| Garbage collection | gc |
Pauses, Max pause | jvm.gc.pause |
| Threads | threads |
Live, Daemon, Peak | jvm.threads.* |
| HTTP throughput | http-throughput |
Requests, 4xx, 5xx | http.server.requests |
| HTTP latency | http-latency |
Avg, Max | http.server.requests |
| HTTP in flight | http-active |
Active requests | http.server.requests.active |
| DB pool | db-pool |
Total, Active, Idle, Pending, Max | hikaricp.connections* |
| DB pool timing | db-pool-timing |
Acquire avg, Usage avg | hikaricp.connections.acquire, .usage |
| JDBC queries | jdbc-queries |
Queries, Avg time | jdbc.query |
| Repositories | repositories |
Invocations, Avg time | spring.data.repository.invocations |
| Transactions | transactions |
Success, Failure | hibernate.transactions |
| Disk space | disk |
Free, Used, Total | disk.free, disk.total |
| Log events | log-events |
Errors, Warnings | logback.events |
These ship switched off. Enable them by id, as shown under
Customise the panels: thread-states (Thread states),
hibernate-activity (Hibernate activity), executors (Executors), open-files (Open files),
tomcat-sessions (Tomcat sessions) and allocation (Memory allocation).
A meter no panel names is not collected.
Peekaboot sets spring.jpa.properties[hibernate.generate_statistics]=true so the Transactions
and Hibernate activity panels have data. Hibernate statistics add overhead to every session.
Set it to false in your own configuration to turn it off; those panels then show “No data”.
Settings and memory cost
| Property | Default | Effect |
|---|---|---|
peekaboot.insights.enabled |
true |
Turns the collector, the Insights tab and the Overview stat tiles on or off |
peekaboot.insights.levels |
10s × 90, 1m × 1440, 1h × 720 |
The resolutions kept, as interval and size (entries per series) |
peekaboot.insights.config-location |
unset | Another location for your panel file. See Customise the panels |
peekaboot.insights.persistence.interval |
the coarsest level’s interval (1h) |
How often history is written to disk while storage is on |
peekaboot.insights.persistence.max-age |
the coarsest level’s interval × size (30 days) | The oldest saved history that is still loaded at startup |
The default levels cover 15 minutes at 10 seconds, 24 hours at 1 minute and 30 days at
1 hour. Setting levels replaces the whole list. Each interval must be a whole multiple of
the one before it and fit inside that level’s ring. A 1m level over 10s needs the 10s
level’s size to be at least 6. A broken rule fails startup with a message naming both
intervals. See
Configuration.
What it costs
Memory grows with the number of series the enabled panels draw and with the level sizes. Each series costs
(level-0 size + sum of higher-level sizes × 8) × 8 bytes
With the default levels that is 138,960 bytes per series. The default panels draw 39 series, so about 5.2 MiB in total. Peekaboot logs the real figure at startup:
Peekaboot insights: <series> series across <panels> panels, levels [10s x90, 1m x1440, 1h x720], ring buffers ~<size>, persisted across restarts
, persisted across restarts appears only while storage is on. Enabling more panels, raising a
size or adding a level all raise the figure.
History across restarts
With peekaboot.storage.enabled
on, the default for a local run, the history is saved to disk and loaded at the next start.
The charts continue where they left off. The downtime shows as a gap, and every start and stop
appears as a restart marker. The markers come from the same history as the
Lifecycle tab. Loading the history never
delays your application’s startup.
History is written once per persistence.interval and at shutdown. Peekaboot discards the
saved file and starts empty when:
- this Peekaboot version cannot read it,
- your
levelschanged since it was written, - it is older than
persistence.max-age, - it is dated more than five minutes in the future.
Each case is logged at INFO. A bad file never fails your application. See
peekaboot.storage for where
the file lives.
Customise the panels
Put a peekaboot-insights.yml in src/main/resources/, or point
peekaboot.insights.config-location at another Spring resource location. Peekaboot’s bundled
panels still load underneath. A missing file is not an error.
Your file is merged with the bundled panels by panel id:
- An entry with no
titleand an existing id patches the shipped panel. Onlyorder,enabledandlevelare taken from your file. Use it to switch a panel on or off, move it, or pin it to a level. - An entry with a
titleand an existing id replaces the shipped panel completely. Series you do not repeat are gone. - An entry with a new id is added and placed by its
order. The defaults use 10, 20, 30 and so on.
An entry with no title and an unknown id fails validation. Tiles also merge by id, but only
by replacement.
panels:
  # patch: switch a shipped-but-off panel on, by id alone
  - id: thread-states
    enabled: true

  # append: your own, between Heap memory (30) and Non-heap memory (40)
  - id: order-queue
    title: Order queue
    chart: line
    unit: count
    order: 35
    series:
      - id: depth
        label: Depth
        meter: orders.queue.depth
      - id: accepted
        label: Accepted
        meter: orders.accepted
        stat: rate
        unit: persec
Find meter names on the Meters tab.
Panel fields
| Field | Values | Default |
|---|---|---|
id |
the merge key, unique across the merged file | required |
title |
the card heading | required, except in a patch |
chart |
line, bars, bars-line |
line |
unit |
bytes, percent, millis, count, persec, bytes-persec |
count |
order |
integer; panels without one sort last, then by id | none |
enabled |
false hides the panel |
enabled |
level |
the level this panel shows by default; must index a configured level | follows the global switch |
series |
the lines to draw | empty |
Series fields
| Field | Values | Default |
|---|---|---|
meter |
the Micrometer meter name | required |
id |
unique within the panel | the meter name |
label |
the legend entry | the meter name |
tags |
narrows which meters of that name are summed | none, so all are summed |
stat |
value, rate, avg, max |
value |
unit |
overrides the panel’s unit for this line | the panel’s |
subtract-meter |
subtracts another meter’s value; only with stat: value |
none |
What each stat plots
stat |
Plots |
|---|---|
value |
The meter’s current value: a gauge, a counter’s total, or a long task timer’s active tasks. A timer or distribution summary gives a gap |
rate |
The count’s increase per second since the previous sample. The first sample is a gap |
avg |
The average duration of the calls since the previous sample. No calls gives a gap |
max |
Micrometer’s MAX for a timer or summary, which covers the last few minutes. See Limitations |
subtract-meter is how the Disk space panel draws Used as disk.total minus disk.free. The
series’ tags apply to both meters. If either meter is missing, the line shows a gap.
A series with no tags sums every meter of that name
Micrometer registers one http.server.requests meter per method, URI, status and outcome. A
series naming it with no tags adds them all up, so HTTP throughput is the whole
application’s request rate. tags: {outcome: SERVER_ERROR} narrows the sum to server errors.
A series cannot pick out a single endpoint. Use Traces
for per-endpoint questions.
Stat tiles
The tiles section of the same file defines the
stat tiles on Overview.
Tile fields
| Field | Values | Default |
|---|---|---|
id, meter |
the tile’s key and the meter behind it | required |
label |
shown above the value | none |
tags |
as for a series | none |
format |
duration, datetime, bytes, count |
raw number |
live |
true re-reads the value on every refresh; false keeps the first value |
false |
A tile always shows the meter’s current value. duration and datetime expect seconds. A
tile over a plain gauge that holds milliseconds shows a value a thousand times too large.
An invalid file is ignored
Peekaboot validates your file at startup. Every panel needs a unique id. Every series needs a
meter and an id unique within its panel. chart, unit, stat and format must be one of
the values above, and subtract-meter needs stat: value. Meter names are not checked, so an
unknown meter shows a permanent gap.
If your file is invalid, Peekaboot ignores the whole file and shows the bundled panels. Your
application still starts. The startup log has an ERROR with the stack trace:
Insights panel config class path resource [peekaboot-insights.yml] is invalid; discarding it entirely and serving the bundled panels instead of the operator's customisation
With config-location set, the resource reads like file [/etc/app/panels.yml]. Check the
log first if your panels do not appear.
Reading the charts
- The level switch in the tab header sets the resolution for every panel. Each panel has its own switch to pin it to another level, and a reset control to follow the header again.
- Levels above the first draw an average line with a min–max band. The percentiles toggle adds p90, p95 and p99 lines.
- Drag across any chart to zoom all charts to the same time window. The reset control or a double-click returns them.
- The Restarts toggle hides the restart markers. It is on by default.
- A gap means no sample. Peekaboot never draws a missed sample as zero.
The charts update live and keep updating while the dashboard’s auto-refresh is paused.
Limitations
The percentiles on the aggregated levels are percentiles of samples, not of individual requests. Use them to see trends and spot leaks or a saturating pool. Do not use them for SLOs; that needs a real metrics backend. See Traces, limitations.
- At
1m, each entry covers six 10-second samples. p90, p95 and p99 all equal the maximum. - At
1h, percentiles are taken over the sixty one-minute averages. A single slow request is averaged away before any percentile is computed. p99 equals the maximum. - The min and max at
1hare the true min and max of the minutes below, so a spike survives in max. stat: maxplots Micrometer’s timer MAX, not the maximum since the previous sample. With Micrometer’s default distribution expiry of 2 minutes over 3 buffers, it covers roughly the last four to six minutes.
The live charts use a streaming connection per open Insights tab. At most 32 are open per
application. A 33rd tab gets 503 until another closes. See
HTTP API.