The dashboard
One tab each for health, live charts, run history, traces, meters, properties, migrations, loggers and schedules.
Open the dashboard
Open /peekaboot under your servlet context path, for example http://localhost:8080/peekaboot.
It redirects to /peekaboot/ui/dashboard/index.html. The landing tab is Overview.
The dashboard exists when all of these hold:
peekaboot.enabledis on. It defaults to on for a local run only.- The application is a servlet web application.
- Spring Boot Actuator is on the classpath. The starter brings it.
You do not need to expose anything on /actuator/**. The dashboard works with no
management.endpoints.web.exposure setting, and management.endpoint.health.show-details
does not hide health components from it.
The dashboard shows your configuration and environment. Read Security and Do I want this in production? before you turn it on anywhere but your own machine.
The header
The strip above the tabs is the same on every tab.
- Updated <time> shows when the data on screen was fetched. The dashboard refetches every 30 seconds. Refresh now fetches immediately. Pause auto-refresh stops the timer until you press it again. The Insights charts keep updating while paused.
- Timezone switches between Browser (the default) and Server. Every timestamp is shown in the chosen zone.
- Language is EN, DE, FR or ES. It formats dates, times and numbers, and localises the cron descriptions on Scheduled Tasks. It defaults to the browser’s language, which is added to the list when it is none of the four.
- Theme is light or dark. The toolbar and the trace detail follow it.
Timezone, language and theme are remembered per browser. The Environment and Config tabs’ Show secrets toggle is not: a reload always starts masked.
Share a view with a link
The URL hash holds the tab, the open trace and the filters. Copy the address bar to share a view.
#environmentopens that tab. The ids areoverview,insights,lifecycle,traces,meters,environment,flyway,loggers,configandscheduled-tasks. Any other id opens Overview.#traces/<traceId>opens that trace’s detail on its Spans page. Append/request,/spans,/queriesor/logsto open another page.#traces/<traceId>/spans?root=<spanId>opens one background task’s own subtree of that trace.
Filters travel as a query string:
| View | Query string |
|---|---|
| Traces | bucket, type, op (#traces?bucket=errors). Without type the list shows every type except Connection Pool; selecting that chip writes type=CONNECTION_POOL |
| Meters, Environment, Config | q, the text filter (#config?q=datasource) |
| Loggers | q plus the configured-only checkbox (#loggers?q=peekaboot&configured=1) |
| Insights | level, the percentiles and restarts toggles, and panels for per-panel level overrides |
| Lifecycle | page |
| An open trace’s Logs page | q, level and span (#traces/<traceId>/logs?level=WARN&q=timeout) |
An invalid bucket, level or page in a link falls back to the default. Theme, language and timezone are never part of a link.
Overview
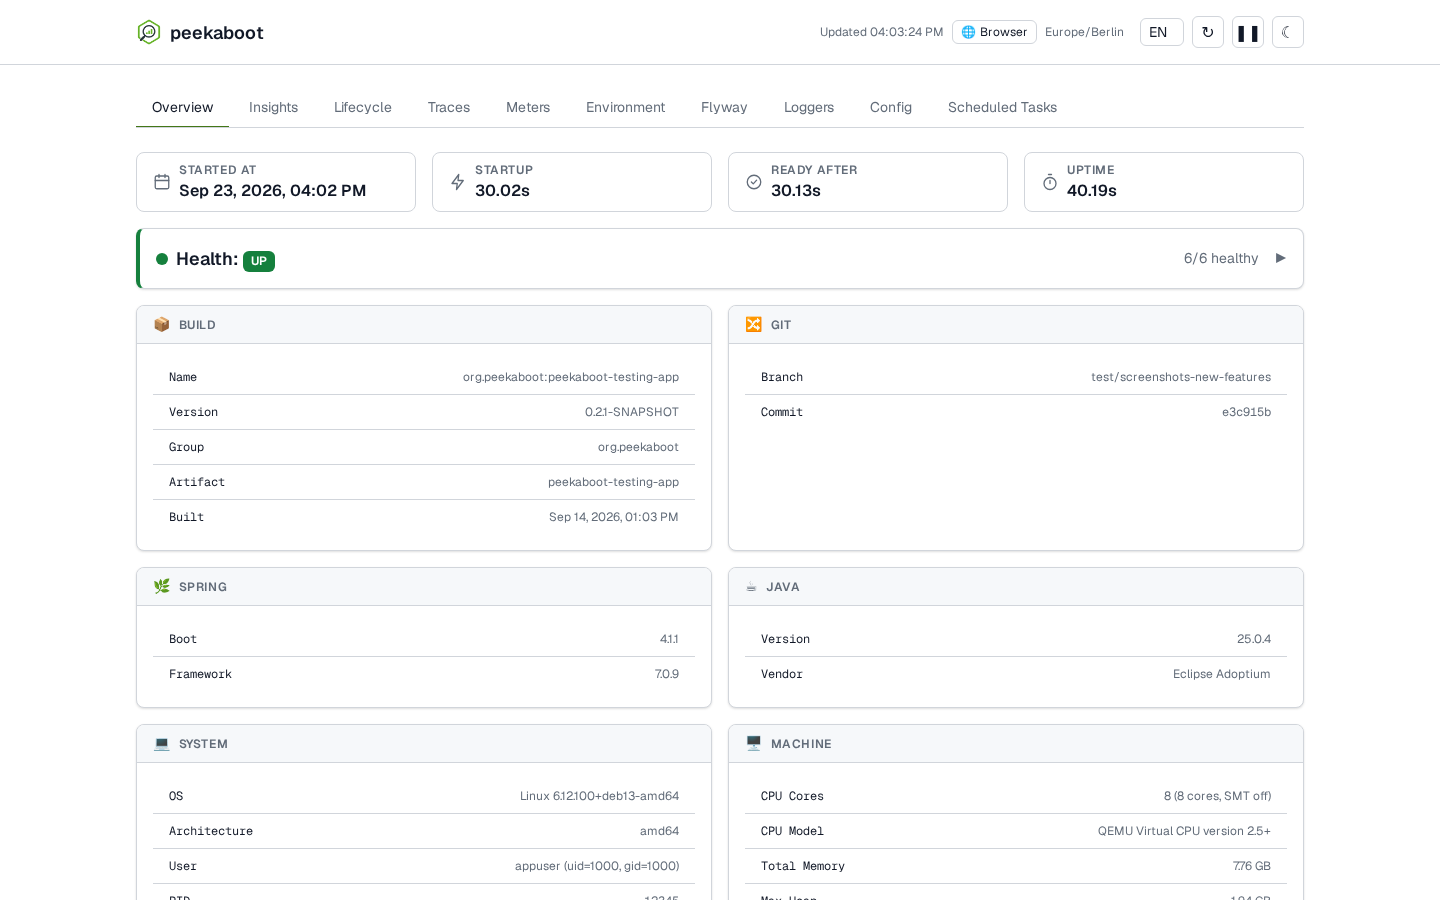
Overview shows the application’s health and what is running. It holds the health banner with
its per-component breakdown, build and Git metadata, Spring Boot and Java versions, OS and JVM
defaults, datasource status, and memory and storage meters. A composite health contributor,
such as Spring’s db with two DataSources, shows as one row with its aggregate status,
followed by its children as db/<name>.
The Machine card shows the logical CPU count (with the CPU model on Linux), total physical
memory, the JVM’s max heap, the machine’s IPv4 and IPv6 addresses with their hostnames where these resolve, and
the container runtime: docker, podman, kubernetes, container or none. Inside a
container, CPU and memory show the container’s limits.
Stat tiles
The row at the top shows Started at, Startup, Ready after and Uptime. Each tile shows a current value only, with no history. Uptime updates on every refresh. The other three keep their first value.
The tiles are defined in the Insights panel file, so you can replace them or add your own
there. See Insights, tile fields.
The row is hidden when Insights is off or has no MeterRegistry.
Insights
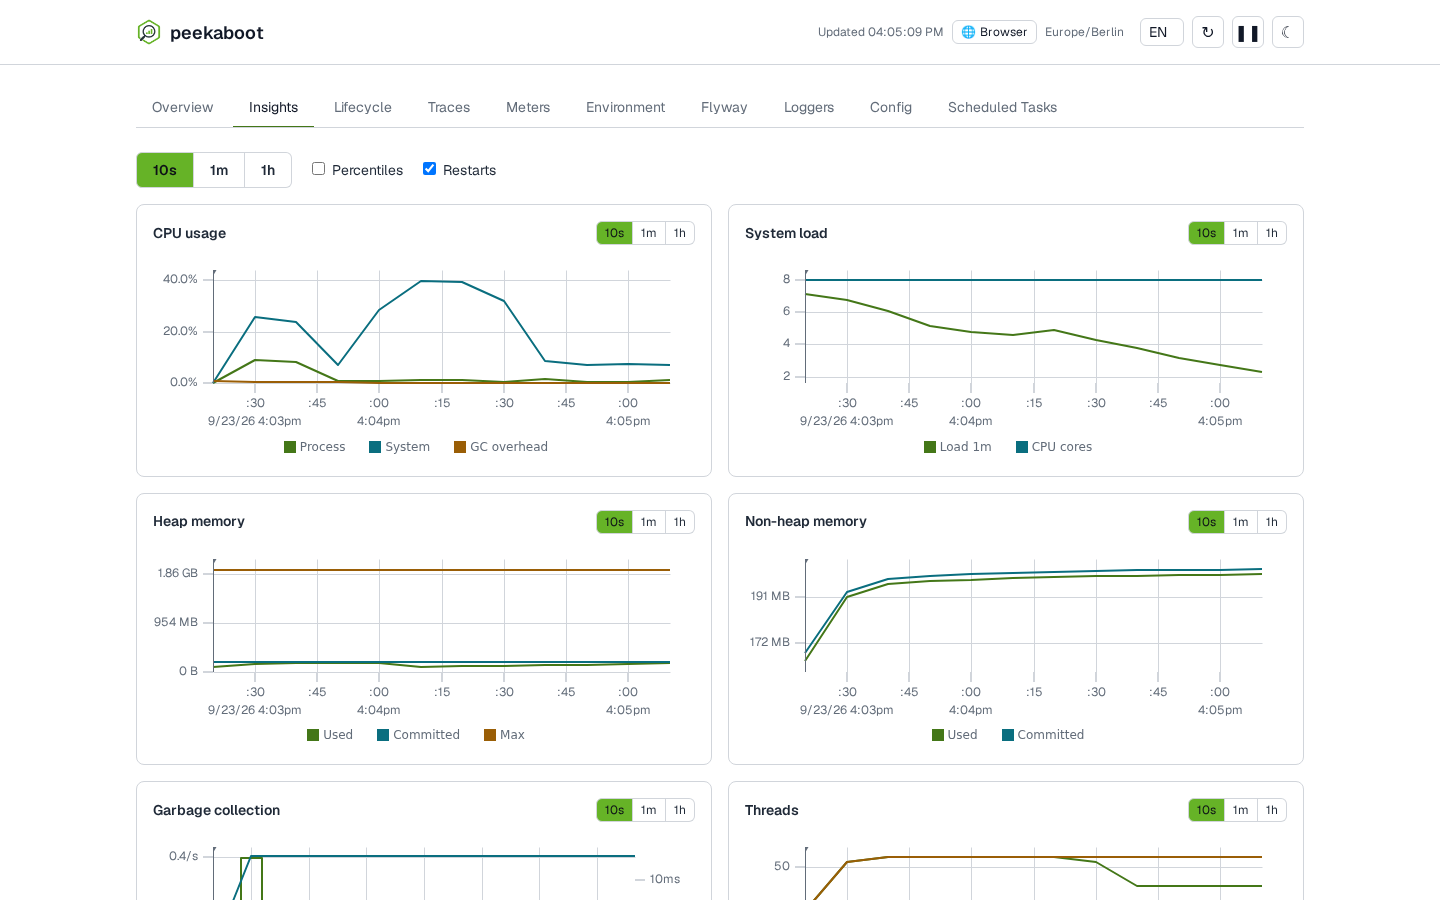
Insights shows live charts of CPU, memory, threads, HTTP, the connection pool and more, over the last minutes, hours or days. Insights covers the default panels, adding your own, the memory cost and the limits of the percentiles.
Lifecycle
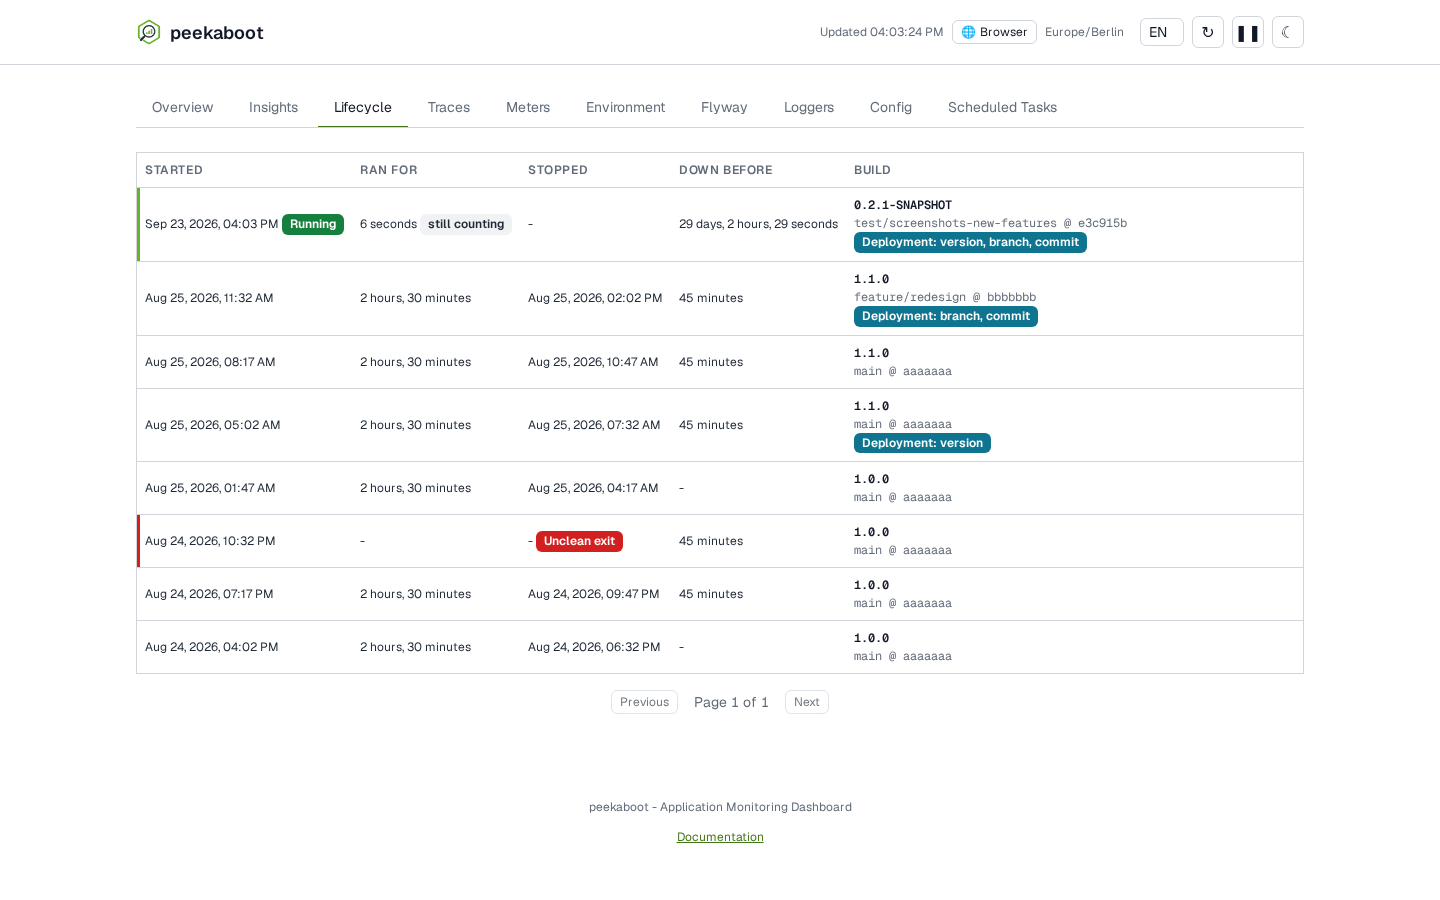
Lifecycle lists every run of the application, newest first, 20 to a page.
| Column | What it shows |
|---|---|
| Started | When the application became ready. The current run carries a Running badge |
| Ran for | How long it ran, with a still counting badge on the current run |
| Stopped | When it shut down. A kill -9, a crash or a power loss records no stop, so the cell shows a dash and an Unclean exit badge |
| Down before | The gap between the previous run’s stop and this run’s start |
| Build | The version, with branch @ commit beneath it and the build time on hover. A Deployment badge names which of the three changed since the previous run |
A dash means the value is unknown. A run with no recorded stop has no duration, and a run after an unclean exit has no downtime.
History across restarts needs
peekaboot.storage.enabled,
on by default for a local run. Without it the tab shows the current run only. With
peekaboot.lifecycle.enabled: false the tab shows “Lifecycle history is unavailable”.
Traces
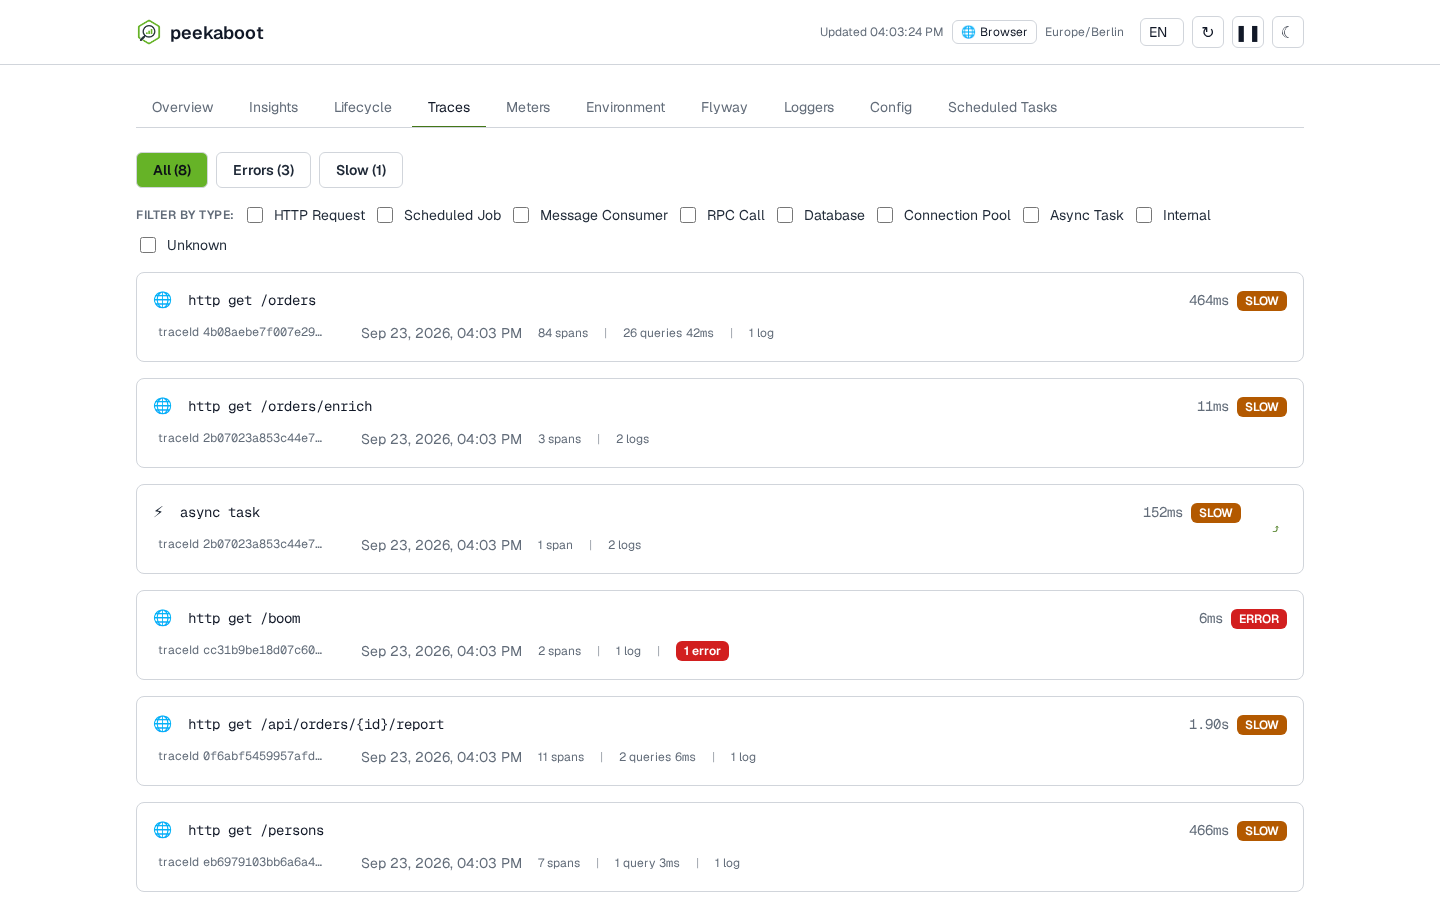
Traces lists recent requests, jobs and messages in three buckets: All, Errors and Slow. You can filter by root action type and root operation. The list shows the 50 newest matches, so a bucket’s count can be higher than the rows under it.
Click a row to open the trace detail with its spans, queries, logs and the HTTP exchange. Background work started from a trace gets its own row. When the trace it ran under is still stored, the row has a View the trace this ran under link. Traces explains buckets, badges, root action types and background work.
Meters
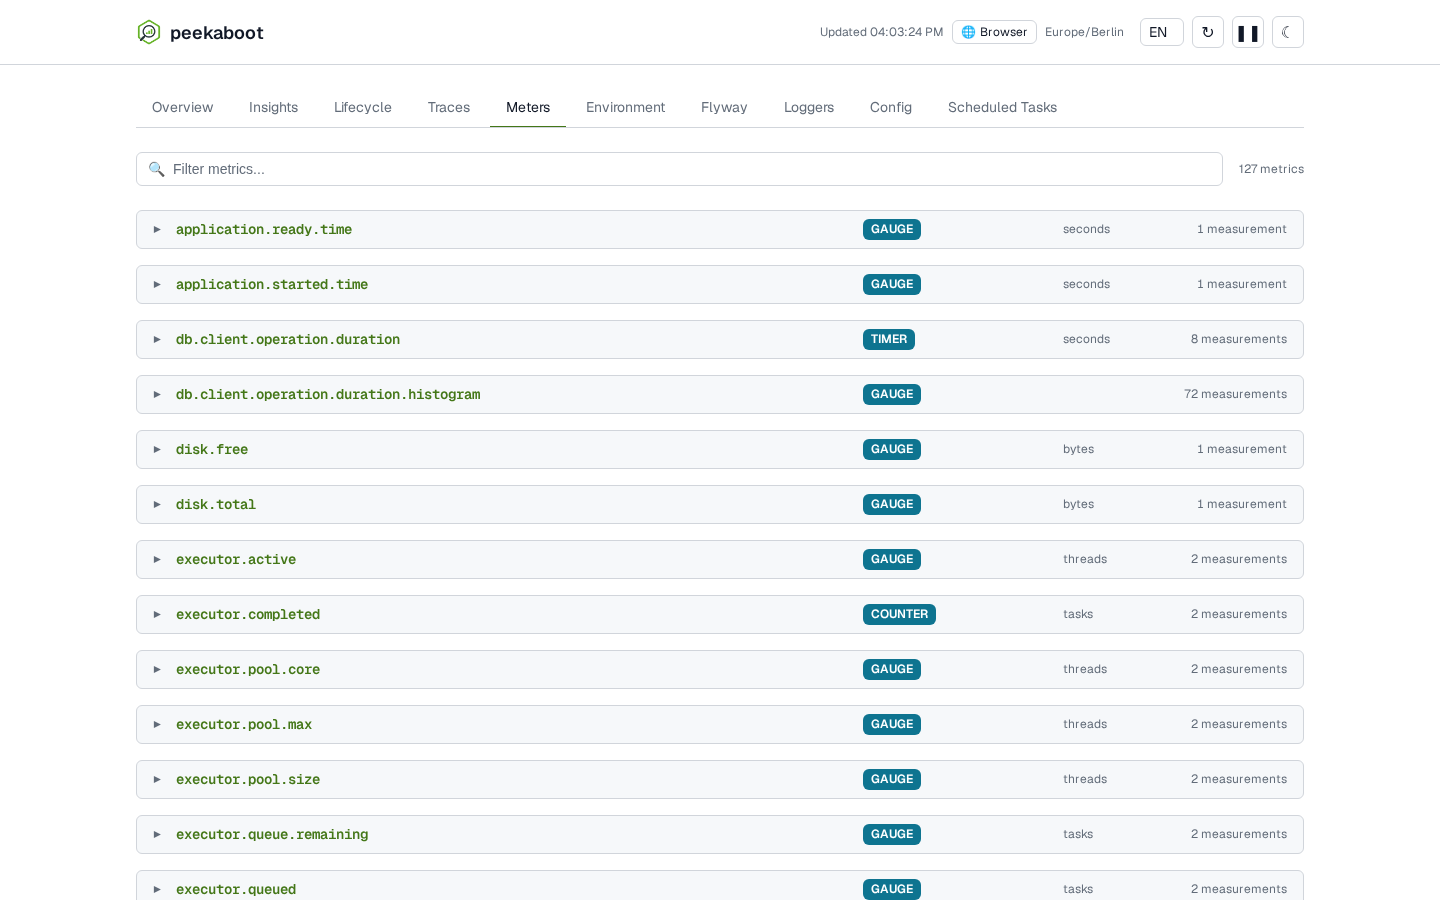
Meters lists every meter in the Micrometer MeterRegistry with its current measurements,
filterable by name or tag. A meter name from this list is what you put in a
panel file series to chart it on
Insights.
Environment
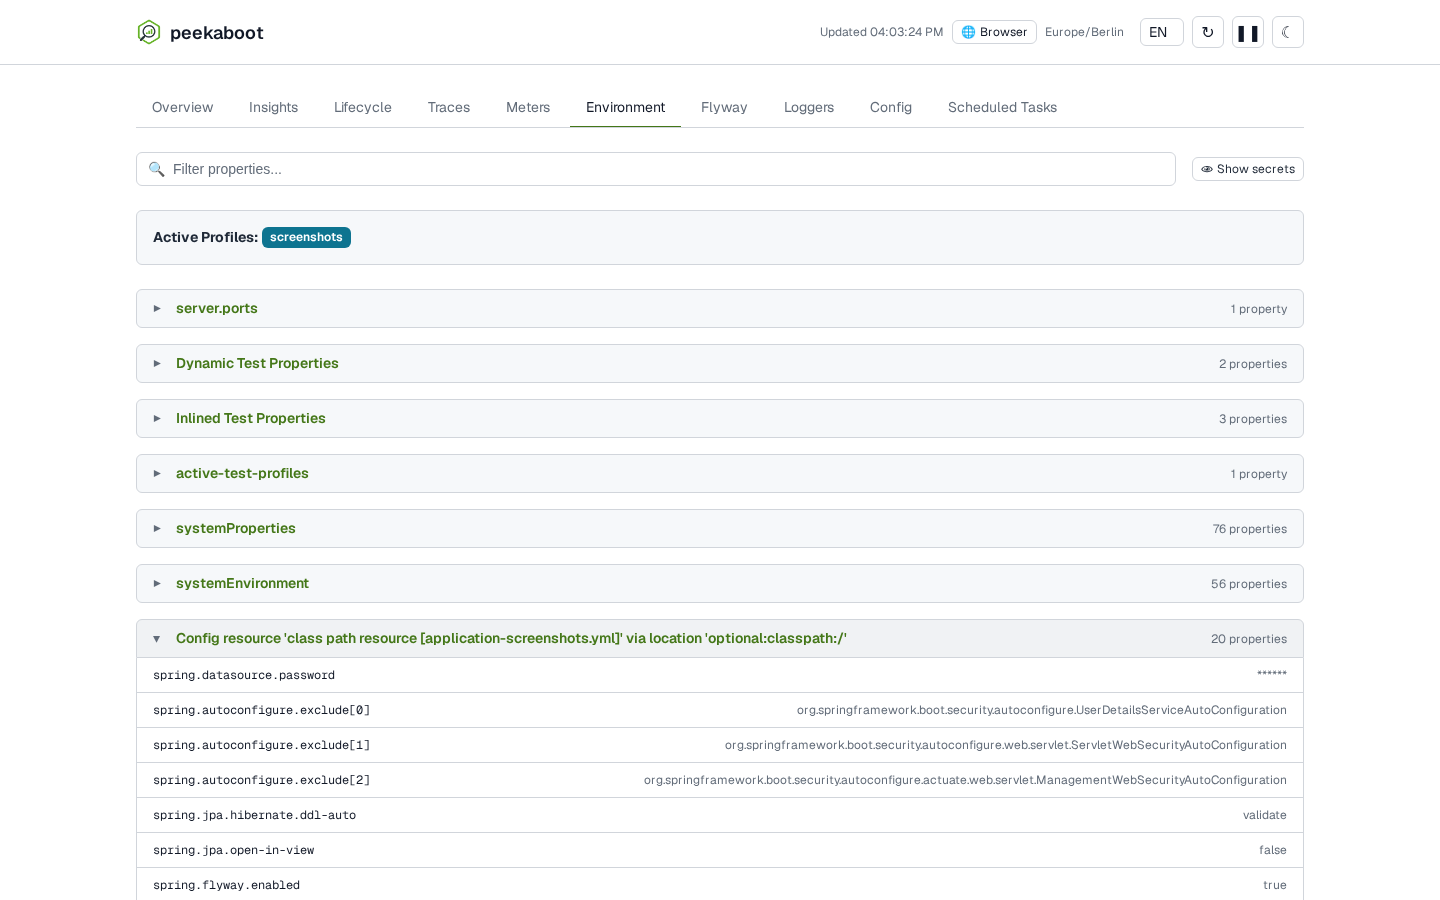
Environment lists every property source Spring resolved, in resolution order, with its raw
keys and values. Command-line arguments, OS environment, system properties,
application.yml and Peekaboot’s own defaults all appear here. The active profiles are
shown above the list. Use it to find which source wins for a key.
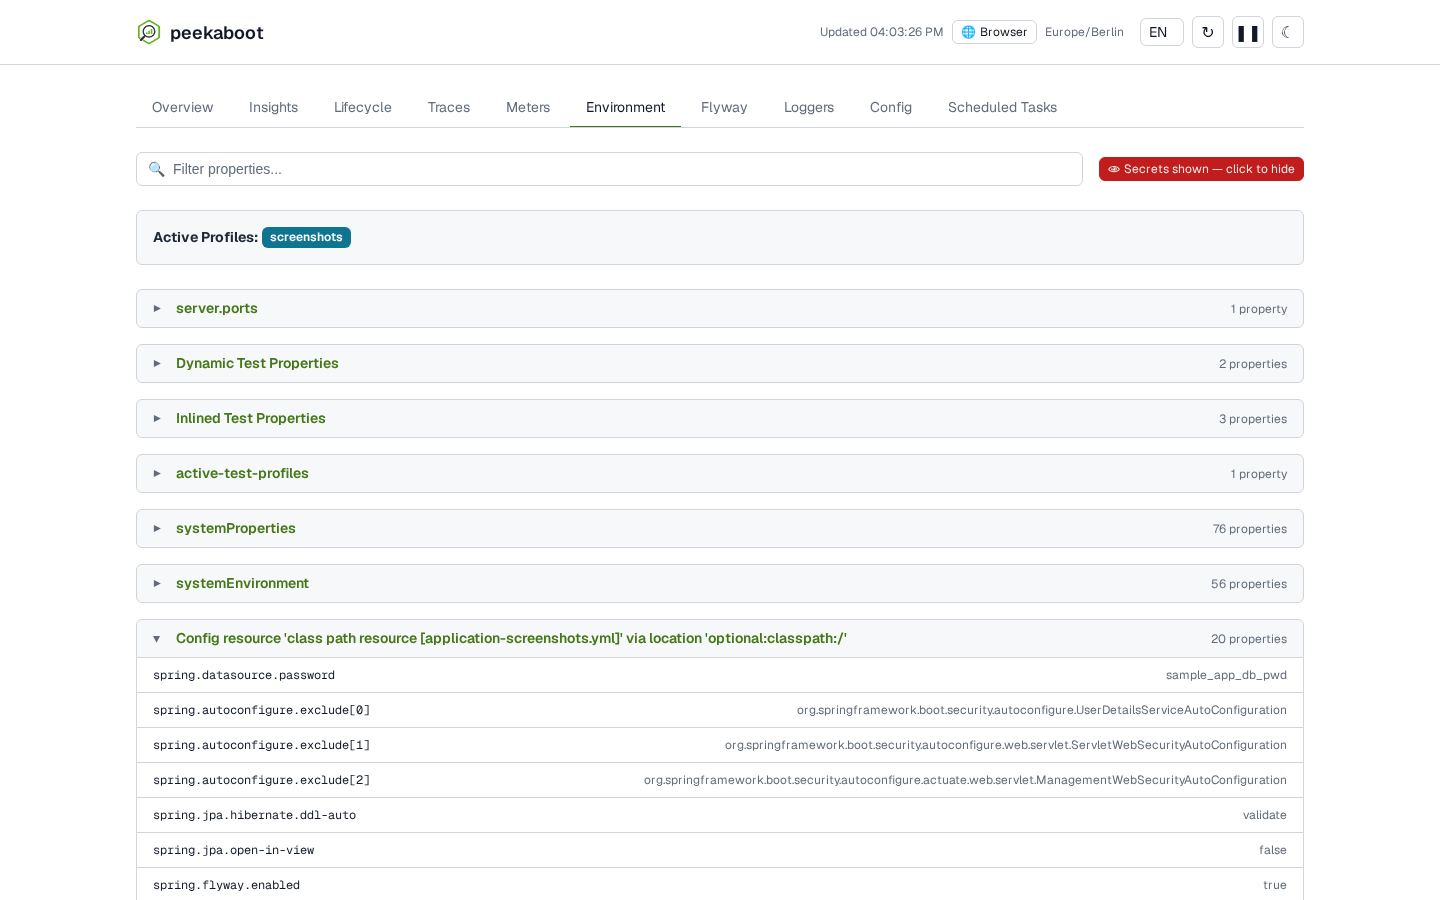
peekaboot.enable-unmasking is on and Show secrets is clicked. See
Security: masking for the
two opt-ins and why this particular value is safe to publish.Flyway
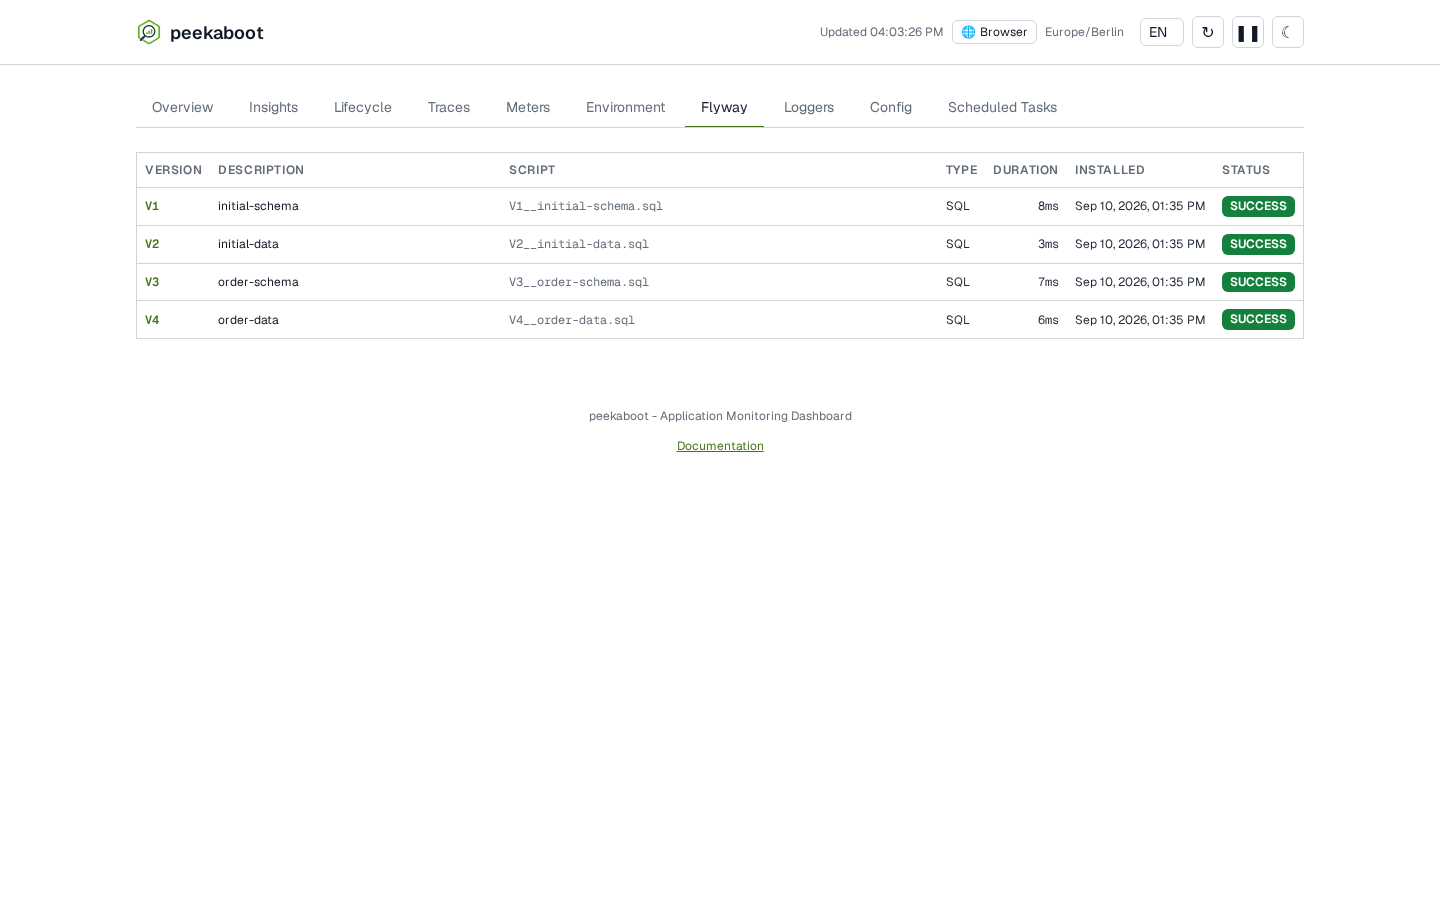
Flyway shows one row per migration: version, description, script, type, duration, install time and status.
Loggers
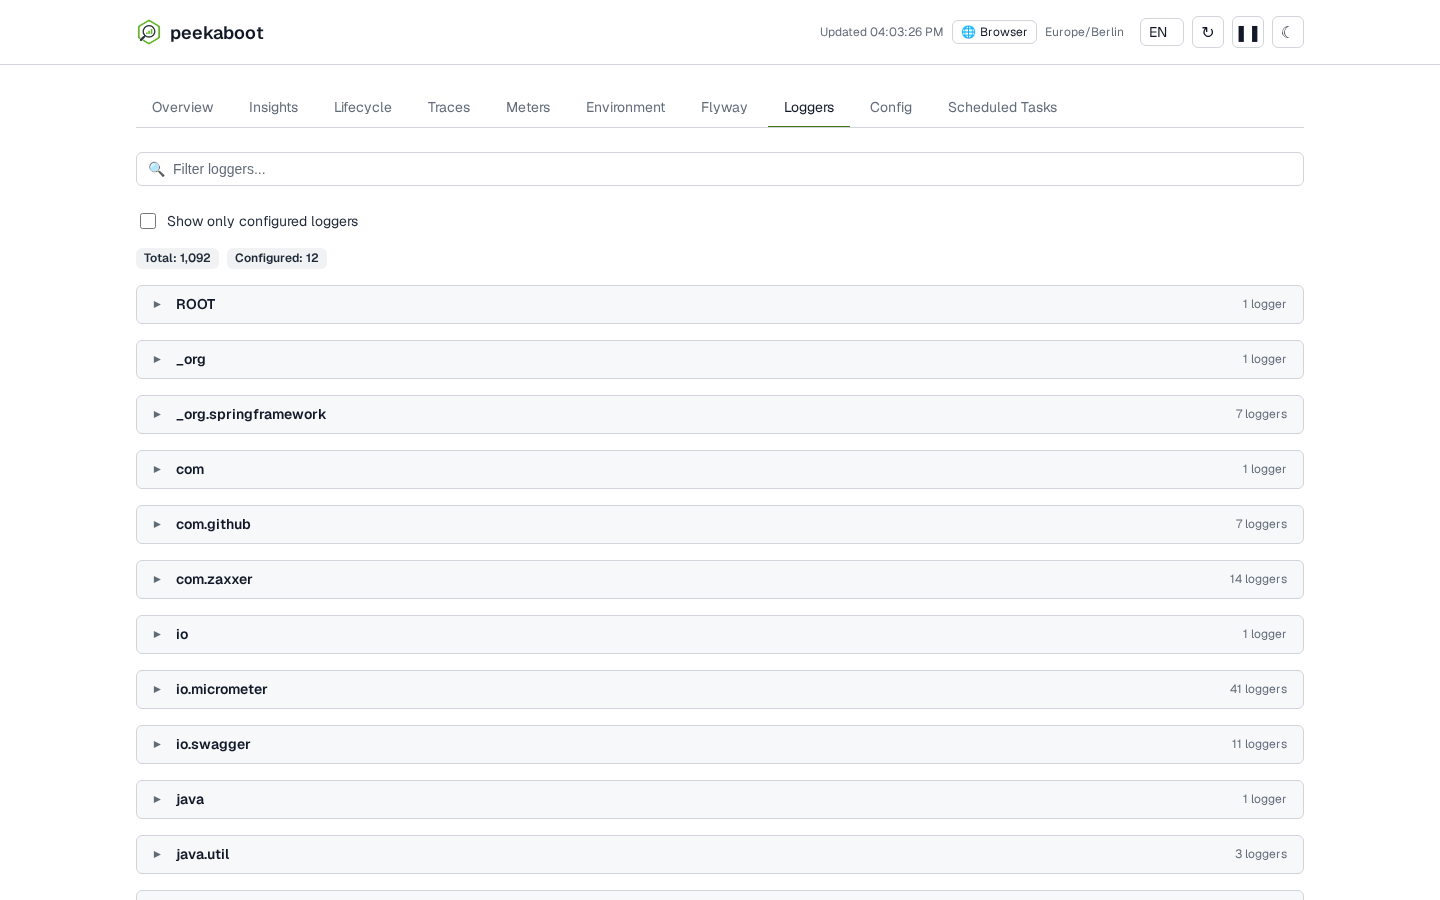
Loggers shows each logger’s effective and configured level, grouped by package. You can filter by name and show only loggers with an explicit level. The tab is read-only. It cannot change a level.
Config
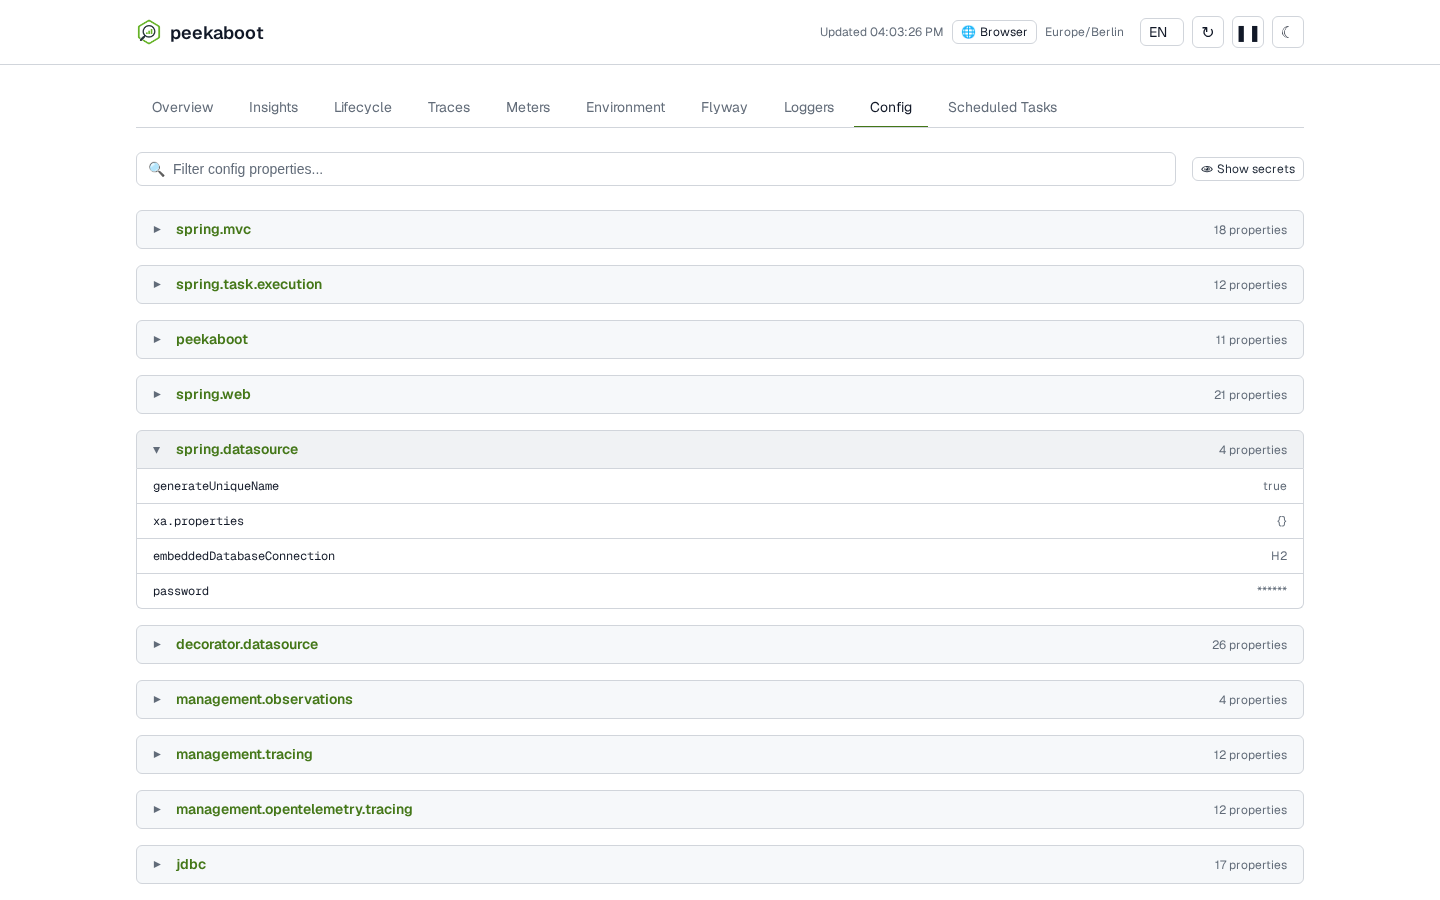
Config shows the values bound to @ConfigurationProperties beans, grouped by prefix. Nested
values get one row each under their full dotted key, such as
registration.google.client-secret, and list entries are indexed as servers[0]. The filter
matches these keys and their values.
Environment vs Config
- Environment shows the input: every property source and the raw value each one supplies. It also shows properties nothing reads, which is how you find typos and dead config.
- Config shows what the application uses, after relaxed binding and type conversion. It includes defaults set in Java code, which appear in no property source.
A property in application.yml that feeds a @ConfigurationProperties bean appears in both.
Code defaults appear only under Config. Unused or overridden values appear only under
Environment. @Value injections are not in Config; look them up under Environment.
Both tabs mask sensitive values by key name and by value shape. Your
management.endpoint.*.show-values settings do not affect this. The rules are under
what gets masked and how.
The Show secrets toggle appears on both tabs when peekaboot.enable-unmasking is on. It
reveals real values on both tabs at once and resets on reload.
Masking is not exhaustive. See Security, masking for what is covered and what is not.
Scheduled Tasks
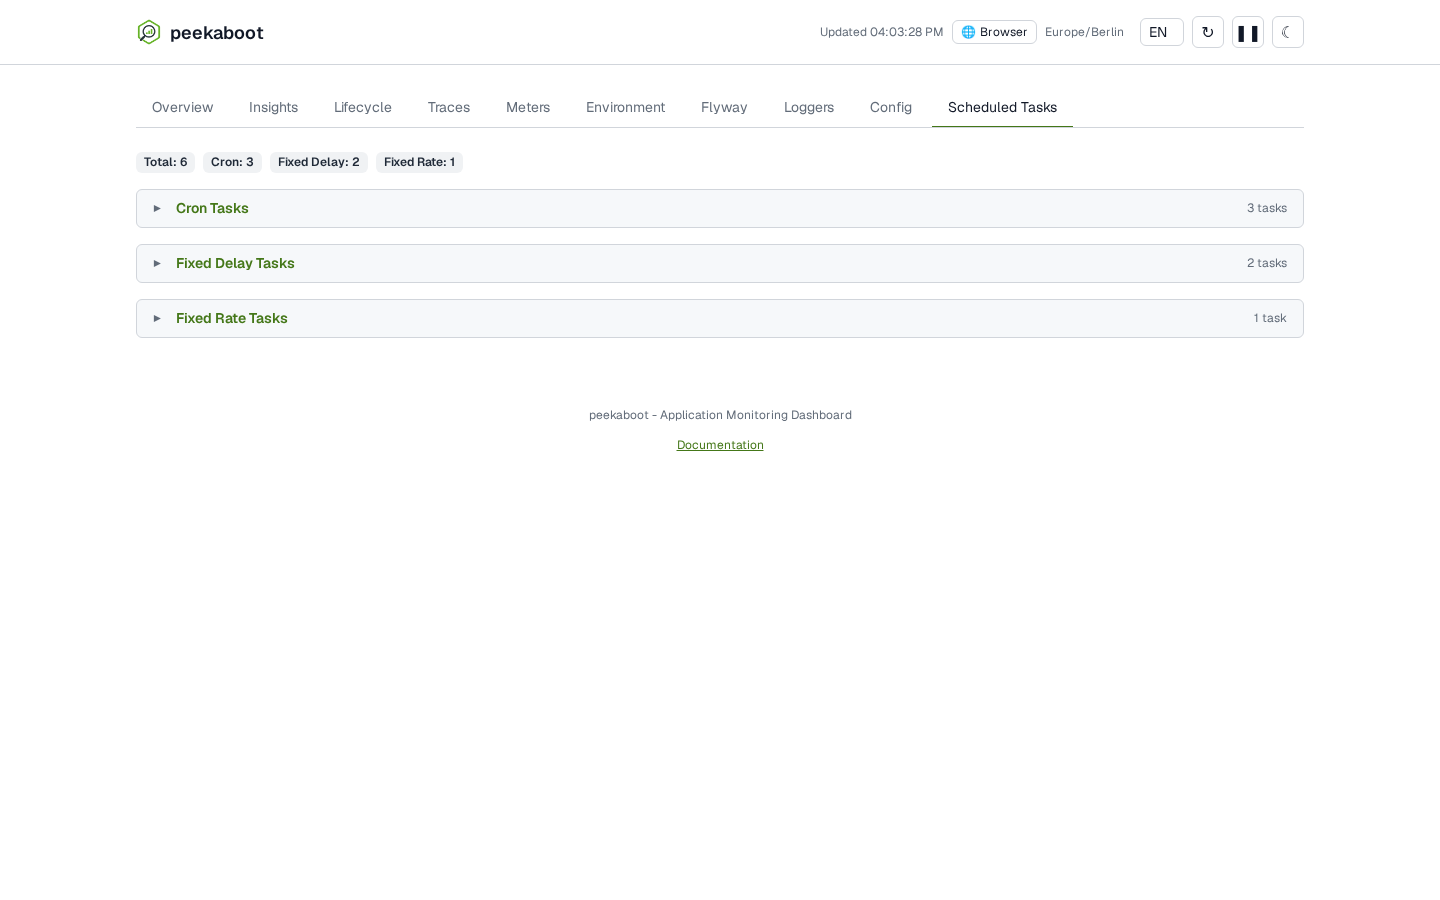
Scheduled Tasks lists @Scheduled methods grouped by type: cron, fixed delay and fixed rate.
Each group expands to its tasks. Cron expressions come with a description in the dashboard’s
language.
Which tabs appear
Overview, Lifecycle and Environment always appear. The others depend on your application:
| Tab | Shown when | Property |
|---|---|---|
| Insights | A Micrometer MeterRegistry bean exists |
peekaboot.insights.enabled |
| Traces | The trace store exists. It stays empty without the OpenTelemetry SDK on the classpath | peekaboot.tracing.enabled |
| Meters | A Micrometer MeterRegistry bean exists |
none |
| Flyway | At least one Flyway migration exists | none |
| Loggers | Logger data is available | none |
| Config | At least one @ConfigurationProperties group exists |
none |
| Scheduled Tasks | At least one scheduled task exists | none |
Spring Boot Actuator provides the MeterRegistry. See
Quick start for the dependencies.
Settings
| Property | Default | Effect |
|---|---|---|
peekaboot.enabled |
on for a local run | Turns the dashboard and its API on. Every other switch needs it |
peekaboot.insights.enabled |
true |
The Insights tab and the Overview stat tiles |
peekaboot.tracing.enabled |
true |
The Traces tab |
peekaboot.lifecycle.enabled |
true |
The run history on the Lifecycle tab |
peekaboot.storage.enabled |
on for a local run | Lifecycle and Insights history across restarts |
peekaboot.enable-unmasking |
false |
The Show secrets toggle on Environment and Config |
peekaboot.ui.tracing.* |
100, 500, 50 ms |
The thresholds for the SLOW, VERY_SLOW and SLOW_QUERY badges on Traces |
All properties are listed under Configuration.